Improving Trend Following Performance
May 28, 2020
Read Time 4 MIN
We have recently experienced the fastest major market decline, from peak-to-trough, in the history of the U.S. stock market. Historically, the natural bias of the U.S. stock market has been upwards. Downward trending prices are a big warning sign that something is amiss and are typically a good signal to get defensive.
The Ned Davis Research CMG US Large Cap Long/Flat Index is designed to protect against major market corrections by changing its allocations from being fully invested in securities that track the S&P 500® Index to a safe portfolio of short duration U.S. Treasury bills. It does this primarily by measuring the stock market’s breadth, by comparing an average of near-term prices to an average of long-term prices to determine if the market is trending upwards or downwards.
Rapid Corrections Are More Often a Time to Buy
During the course of the 2020 correction, the Long/Flat Index remained fully invested. Why did the model remain invested in the worst correction ever?
The model did not move to cash, because in addition to measuring breadth, the model also looks for buying opportunities. More specifically, rapid corrections in stock prices are typically a reason to buy, not sell. Hence the saying, “buy the dip.” The underlying index incorporates a mean-reversion indicator which boosts the model’s Breadth Score during extreme selloffs (effectively triggering a buy signal). Historically, when mean-reversion indicators trigger a buy signal, the market has outperformed over the next month.
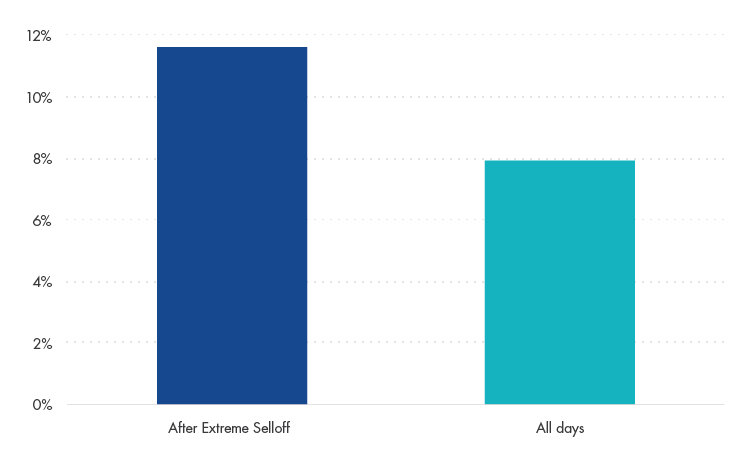
To prove this point, we tested the idea on the S&P 500® Index going all the way back to January 31, 1928. In the one-month period following these extreme near-term price declines, the average annualized return for the S&P 500® Index was 11.64% versus the average annualized return in other periods of 7.94%.1
S&P 500 Average Annualized 1-Year Returns
Source: VanEck
The Limitations of Pure Trend-Following
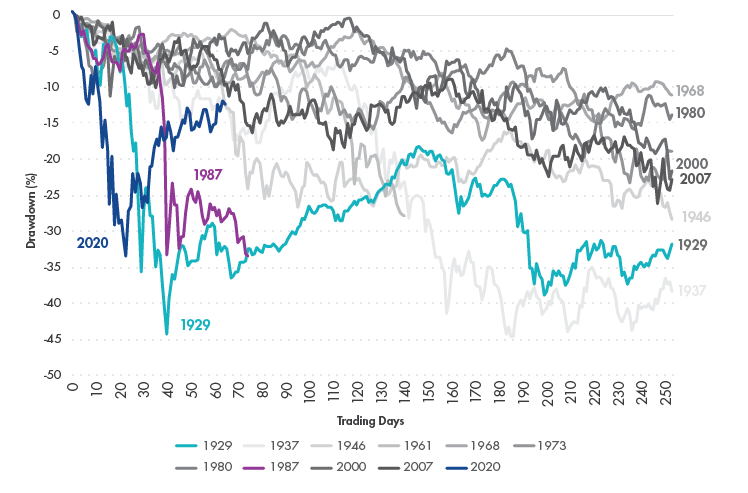
To better understand what happened, we must contextualize the 2020 drawdown. As everyone knows, the trigger for the correction was a global health pandemic that most were not expecting, followed by a government-forced shutdown of the economy. The chart below shows each major U.S. historical market drawdown. As you can see, the current bear market is second to none in terms of its swift severity.
A Market Like No Other: Historical Drawdowns
Source: FactSet. Data as of May 22, 2020.
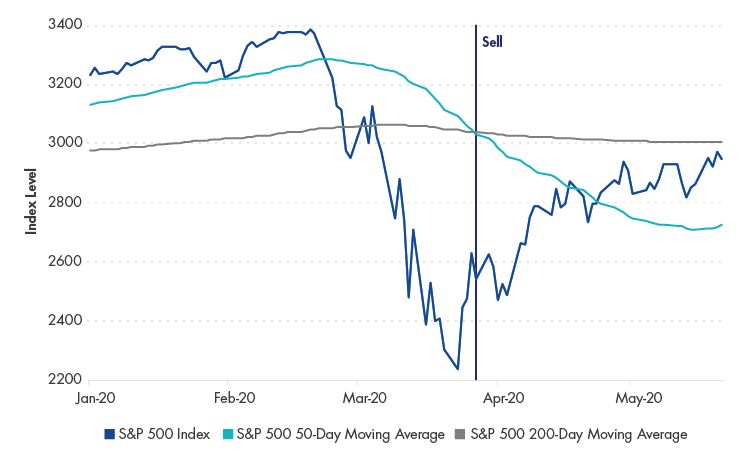
The S&P 500® Index peaked at 3,386 on February 19 and then fell off a cliff. It eventually bottomed at 2,237 on March 23, posting a peak-to-trough drawdown of approximately 34%! Most attempts to get defensive based on trend following alone would have likely been too late and resulted in selling near the bottom.
Why This Correction Was Different
The Global Financial Crisis (GFC) was our last major correction and it took a typical route “south.” In 2007, financial institutions with exposure to the housing market began to go bankrupt as housing prices fell, shedding light on just how much leverage was in the system. In the summer of 2007, the S&P 500 reacted with increased volatility and falling prices as the market began digesting the seriousness of the situation.
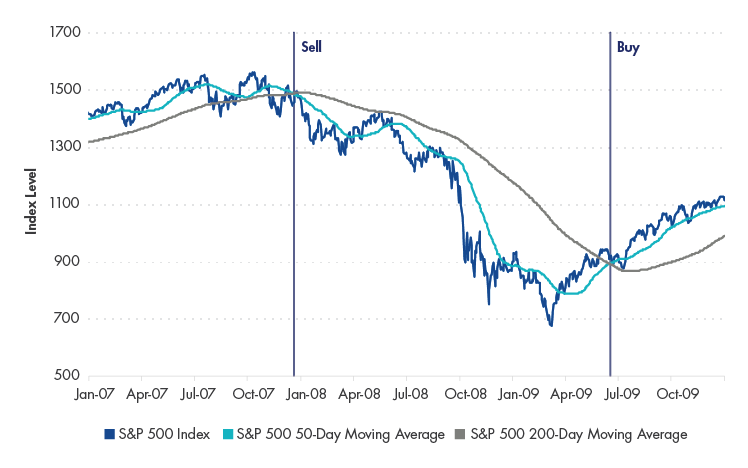
The popularly watched 50 x 200-day moving average (MA), or what is commonly referred to as the “death-cross,” performed well during the GFC. When the 50-day MA falls below the 200-day MA, it is a signal that prices are trending downward, and it is probably a good time to start thinking about playing defense. This signal got defensive in December 2007, well in advance of the most severe part of the correction.
Defensive Signal in 2007
Source: Bloomberg
This time around, in 2020, there was just no time in which to react. We went from a 3.5% unemployment rate and all-time highs in the stock market to the highest unemployment levels since the Great Depression and the fastest major stock market correction ever in just over one month.
Compared to the results of 2007, the 50 x 200 day MA strategy did not hold up. Unsurprisingly, as the chart below shows, it would have signaled “sell” late into March and near the market bottom.
No Chance to React in 2020
Source: Bloomberg
Sometimes It’s Better to Do Nothing at All
We believe traditional trend following had no realistic chance of getting defensive early into the recent correction. Given the market’s upward bias and tendency for strong rebounds after major market sell-offs, we think sometimes it’s better to wait than react. One potential solution is to evaluate trends over multiple time periods and pair trend signals with a mean reversion indicator to help limit whipsaws or selling at the bottom.
VanEck Vectors® Long/Flat Trend ETF (LFEQ®) seeks to track the Ned Davis Research CMG US Large Cap Long/Flat Index. The underlying methodology measures the stock market’s breadth, by comparing an average of near-term prices to an average of long-term prices to determine if the market is trending either upwards or downwards. Additionally, the index also incorporates mean-reversion indicators to help to protect from selling at or near the bottom.2 We believe that such a thoughtfully-constructed, systematic approach to equity investing may allow investors to participate in the upside, while potentially side-stepping destructive bear markets.
Related Insights
February 28, 2024
February 22, 2024
December 19, 2023
DISCLOSURES
1 Extreme near-term sell-offs are measured using z scores of current prices relative to 20-day price averages and a -2 standard deviation event or greater.
2 In this blog post we have used simplified examples to easily communicate the general methodology of LFEQ. The actual methodology of LFEQ, while very similar to what was described here, uses more advanced techniques to measure market price activity.
The information presented does not involve the rendering of personalized investment, financial, legal, or tax advice. Certain statements contained herein may constitute projections, forecasts and other forward looking statements, which do not reflect actual results, are valid as of the date of this communication and subject to change without notice. Information provided by third party sources are believed to be reliable and have not been independently verified for accuracy or completeness and cannot be guaranteed. The information herein represents the opinion of the author(s), but not necessarily those of VanEck.
Any graphs shown herein are for illustrative purposes only. The indices listed are unmanaged indices and do not reflect the payment of transaction costs, advisory fees, or expenses that are associated with an investment in any underlying exchange-traded funds. Certain indices may take into account withholding taxes. Index performance is not illustrative of fund performance. Fund performance current to the most recent month end is available by visiting vaneck.com. Indexes are not securities in which an investment can be made.
Ned Davis Research CMG US Large Cap Long/Flat Index is a rules-based index that follows a proprietary model developed by Ned Davis Research, Inc. in conjunction with CMG Capital Management Group, Inc. The model produces daily trade signals to determine the Index’s equity allocation percentage (100%, 50%, or 0%). When allocated to a percentage of equities (long), that portion of the Index will comprise the S&P 500 Index. When allocated to a percentage of cash (flat), that portion of the Index will be allocated to the Solactive 13-week U.S. T-bill Index.M
Solactive 13-week U.S. T-bill Index is a rules-based index mirroring the performance of the current U.S. 13-week T-bill.
S&P 500® Index consists of 500 widely held U.S. common stocks covering the industrial, utility, financial and transportation sectors.
NEITHER NDR NOR CMG GUARANTEE THE ACCURACY AND/OR THE COMPLETENESS OF THE INDEX OR ANY DATA INCLUDED THEREIN AND NEITHER NDR NOR CMG SHALL HAVE ANY LIABILITY WHATSOEVER FOR ANY ERRORS, OMISSIONS, OR INTERRUPTIONS THEREIN. NDR AND CMG MAKE NO WARRANTY, EXPRESS OR IMPLIED, AS TO RESULTS TO BE OBTAINED BY LICENSEE, OWNERS OF THE FUND, OR ANY OTHER PERSON OR ENTITY FROM THE USE OF THE INDEX OR ANY DATA INCLUDED THEREIN. NDR AND CMG MAKE NO EXPRESS OR IMPLIED WARRANTIES, AND EXPRESSLY DISCLAIM ALL WARRANTIES OF MERCHANTABILITY OR FITNESS FOR A PARTICULAR PURPOSE OR USE WITH RESPECT TO THE INDEX OR ANY DATA INCLUDED THEREIN. WITHOUT LIMITING ANY OF THE FOREGOING, IN NO EVENT SHALL NDR OR CMG HAVE ANY LIABILITY, JOINTLY OR SEVERALLY, FOR ANY SPECIAL, PUNITIVE, INDIRECT, OR CONSEQUENTIAL DAMAGES (INCLUDING LOST PROFITS), EVEN IF NOTIFIED OF THE POSSIBILITY OF SUCH DAMAGES.
The S&P 500 Index is a product of S&P Dow Jones Indices LLC and/or its affiliates and has been licensed for use by Van Eck Associates Corporation. Copyright © 2018 S&P Dow Jones Indices LLC, a division of S&P Global, Inc., and/or its affiliates. All rights reserved. Redistribution or reproduction in whole or in part are prohibited without written permission of S&P Dow Jones Indices LLC. For more information on any of S&P Dow Jones Indices LLC’s indices please visit www.spdji.com. S&P® is a registered trademark of S&P Global and Dow Jones® is a registered trademark of Dow Jones Trademark Holdings LLC. Neither S&P Dow Jones Indices LLC, Dow Jones Trademark Holdings LLC, their affiliates nor their third party licensors make any representation or warranty, express or implied, as to the ability of any index to accurately represent the asset class or market sector that it purports to represent and neither S&P Dow Jones Indices LLC, Dow Jones Trademark Holdings LLC, their affiliates nor their third party licensors shall have any liability for any errors, omissions, or interruptions of any index or the data included therein.
Diversification does not assure a profit nor protect against loss.
The VanEck Vectors® Long/Flat Trend ETF (LFEQ®) is subject to risks associated with equity securities, index tracking, investing in other funds, market, U.S. Treasury bills, operational, high portfolio turnover, fund shares trading, premium/discount risk and liquidity of fund shares, passive management, no guarantee of active trading market, authorized participant concentration, trading issues, non-diversified and concentration risks. The Fund is considered non-diversified and may be subject to greater risks than a diversified fund.
Investing involves substantial risk and high volatility, including possible loss of principal. An investor should consider the investment objective, risks, charges and expenses of the Fund carefully before investing. To obtain a prospectus and summary prospectus, which contains this and other information, call 800.826.2333 or visit vaneck.com. Please read the prospectus and summary prospectus carefully before investing.
Related Funds
DISCLOSURES
1 Extreme near-term sell-offs are measured using z scores of current prices relative to 20-day price averages and a -2 standard deviation event or greater.
2 In this blog post we have used simplified examples to easily communicate the general methodology of LFEQ. The actual methodology of LFEQ, while very similar to what was described here, uses more advanced techniques to measure market price activity.
The information presented does not involve the rendering of personalized investment, financial, legal, or tax advice. Certain statements contained herein may constitute projections, forecasts and other forward looking statements, which do not reflect actual results, are valid as of the date of this communication and subject to change without notice. Information provided by third party sources are believed to be reliable and have not been independently verified for accuracy or completeness and cannot be guaranteed. The information herein represents the opinion of the author(s), but not necessarily those of VanEck.
Any graphs shown herein are for illustrative purposes only. The indices listed are unmanaged indices and do not reflect the payment of transaction costs, advisory fees, or expenses that are associated with an investment in any underlying exchange-traded funds. Certain indices may take into account withholding taxes. Index performance is not illustrative of fund performance. Fund performance current to the most recent month end is available by visiting vaneck.com. Indexes are not securities in which an investment can be made.
Ned Davis Research CMG US Large Cap Long/Flat Index is a rules-based index that follows a proprietary model developed by Ned Davis Research, Inc. in conjunction with CMG Capital Management Group, Inc. The model produces daily trade signals to determine the Index’s equity allocation percentage (100%, 50%, or 0%). When allocated to a percentage of equities (long), that portion of the Index will comprise the S&P 500 Index. When allocated to a percentage of cash (flat), that portion of the Index will be allocated to the Solactive 13-week U.S. T-bill Index.M
Solactive 13-week U.S. T-bill Index is a rules-based index mirroring the performance of the current U.S. 13-week T-bill.
S&P 500® Index consists of 500 widely held U.S. common stocks covering the industrial, utility, financial and transportation sectors.
NEITHER NDR NOR CMG GUARANTEE THE ACCURACY AND/OR THE COMPLETENESS OF THE INDEX OR ANY DATA INCLUDED THEREIN AND NEITHER NDR NOR CMG SHALL HAVE ANY LIABILITY WHATSOEVER FOR ANY ERRORS, OMISSIONS, OR INTERRUPTIONS THEREIN. NDR AND CMG MAKE NO WARRANTY, EXPRESS OR IMPLIED, AS TO RESULTS TO BE OBTAINED BY LICENSEE, OWNERS OF THE FUND, OR ANY OTHER PERSON OR ENTITY FROM THE USE OF THE INDEX OR ANY DATA INCLUDED THEREIN. NDR AND CMG MAKE NO EXPRESS OR IMPLIED WARRANTIES, AND EXPRESSLY DISCLAIM ALL WARRANTIES OF MERCHANTABILITY OR FITNESS FOR A PARTICULAR PURPOSE OR USE WITH RESPECT TO THE INDEX OR ANY DATA INCLUDED THEREIN. WITHOUT LIMITING ANY OF THE FOREGOING, IN NO EVENT SHALL NDR OR CMG HAVE ANY LIABILITY, JOINTLY OR SEVERALLY, FOR ANY SPECIAL, PUNITIVE, INDIRECT, OR CONSEQUENTIAL DAMAGES (INCLUDING LOST PROFITS), EVEN IF NOTIFIED OF THE POSSIBILITY OF SUCH DAMAGES.
The S&P 500 Index is a product of S&P Dow Jones Indices LLC and/or its affiliates and has been licensed for use by Van Eck Associates Corporation. Copyright © 2018 S&P Dow Jones Indices LLC, a division of S&P Global, Inc., and/or its affiliates. All rights reserved. Redistribution or reproduction in whole or in part are prohibited without written permission of S&P Dow Jones Indices LLC. For more information on any of S&P Dow Jones Indices LLC’s indices please visit www.spdji.com. S&P® is a registered trademark of S&P Global and Dow Jones® is a registered trademark of Dow Jones Trademark Holdings LLC. Neither S&P Dow Jones Indices LLC, Dow Jones Trademark Holdings LLC, their affiliates nor their third party licensors make any representation or warranty, express or implied, as to the ability of any index to accurately represent the asset class or market sector that it purports to represent and neither S&P Dow Jones Indices LLC, Dow Jones Trademark Holdings LLC, their affiliates nor their third party licensors shall have any liability for any errors, omissions, or interruptions of any index or the data included therein.
Diversification does not assure a profit nor protect against loss.
The VanEck Vectors® Long/Flat Trend ETF (LFEQ®) is subject to risks associated with equity securities, index tracking, investing in other funds, market, U.S. Treasury bills, operational, high portfolio turnover, fund shares trading, premium/discount risk and liquidity of fund shares, passive management, no guarantee of active trading market, authorized participant concentration, trading issues, non-diversified and concentration risks. The Fund is considered non-diversified and may be subject to greater risks than a diversified fund.
Investing involves substantial risk and high volatility, including possible loss of principal. An investor should consider the investment objective, risks, charges and expenses of the Fund carefully before investing. To obtain a prospectus and summary prospectus, which contains this and other information, call 800.826.2333 or visit vaneck.com. Please read the prospectus and summary prospectus carefully before investing.

