The Moat Stocks that Powered 2019 Outperformance
January 07, 2020
Read Time 5 MIN
2019 was an impressive capstone to an equally impressive decade for the Morningstar® Wide Moat Focus IndexSM (“Moat Index”). Superior stock selection was the theme of the year, with KLA Corp. (KLAC), Applied Materials Inc. (AMAT) and Facebook (FB) being the top contributors to Moat Index performance. Each company benefits from sustainable competitive advantages according to Morningstar equity analysts, and the Moat Index allocated to these companies at attractive entry points based on their market price relative to Morningstar’s assessment of fair value. The Moat Index finished the year ahead of the S&P 500 Index by more than four percent (35.65% vs. 31.49%, respectively) and led in all standard trailing periods for the decade.
Decade of Outperformance
Trailing Return (%) as of 12/31/2019
All Systems Are Go for This Semiconductor Moat Stock
KLA Corp. may not be a household name, but it is a powerhouse in the semiconductor industry. According to Morningstar, its portfolio process, diagnostics and control tools combined with its leading technical expertise allow KLAC products to be in every major chip manufacturing facility in the world.
2010 was the last time KLAC was present in the Moat Index. At the time it traded at a steep discount to Morningstar’s fair value estimate but has since traded mostly at or above fair value until a buying opportunity presented itself. KLAC was first added to the Moat Index in September 2018 and its weighting was subsequently increased in December 2018. The discount to fair value has since eroded, and KLAC ended the year trading above Morningstar’s fair value estimate.
KLAC’s position was scaled back in September 2019 allowing the Moat Index to lock in much of the gains during that period.
KLA Corp (KLAC)
Price and Fair Value of 1/1/19 - 12/31/19
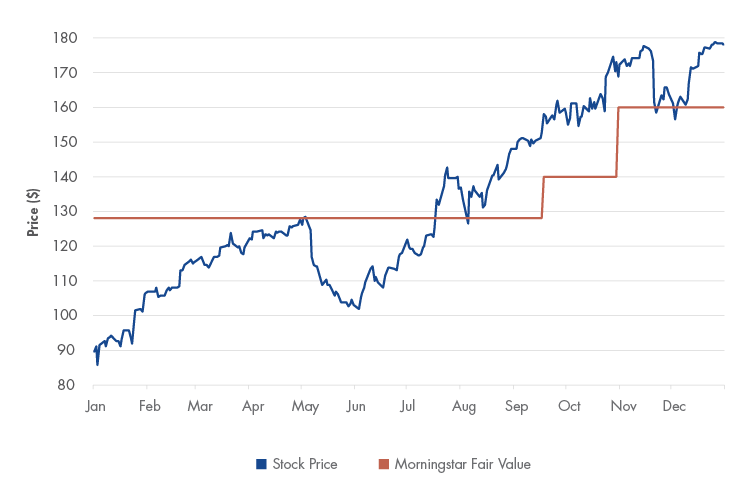
Source: Morningstar. Past performance is no guarantee of future results. For illustrative purposes only. Not a recommendation to buy or sell any security. Visit vaneck.com to view daily ETF and index holdings.
Another Semiconductor Moat Stock Chipping In
Another member of the semiconductor industry, Applied Materials, followed a similar near-term allocation pattern in the Moat Index. AMAT supplies semiconductor manufacturing equipment and benefits from intangible assets related to its equipment design expertise and R&D cost advantages, according to Morningstar. Major chipmakers typically develop strong relationships with their equipment company that span multiple steps of their chip production process. In short, AMAT’s materials engineering solutions are involved in making nearly every chip in the world.
As the semiconductor industry struggled through the second half of 2018, AMAT presented an attractive entry point relative to Morningstar’s fair value estimate. It was added to the Moat Index in September 2018 and December 2018 at steep discounts to fair value, particularly in December 2018 when AMAT was trading at less than 70% of Morningstar’s fair value estimate. The Moat Index pared back its AMAT weighting in September 2019, and the stock finished 2019 near fair value, according to Morningstar. Unlike KLAC, AMAT has been a frequent member of the Moat Index, making five separate appearances including one that lasted nearly four years.
Applied Materials Inc. (AMAT)
Price and Fair Value of 1/1/19 - 12/31/19
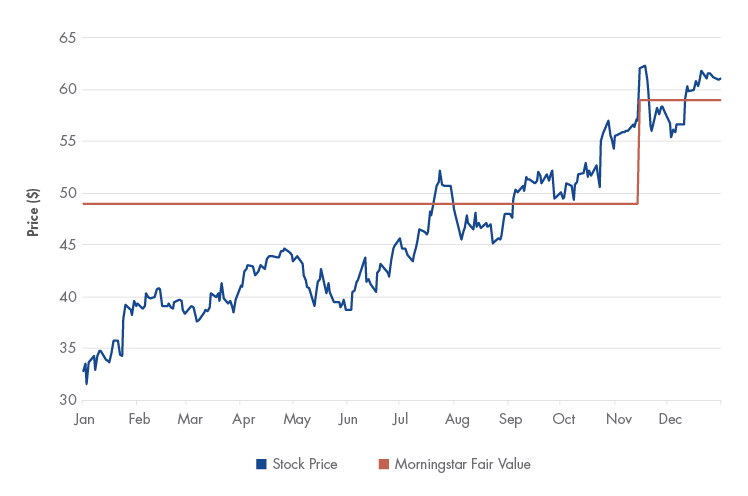
Source: Morningstar. Past performance is no guarantee of future results. For illustrative purposes only. Not a recommendation to buy or sell any security. Visit vaneck.com to view daily ETF and index holdings.
Do You Like This Moat Stock Now?
I’ve written about Facebook before and for good reason: it was the top contributing company to Moat Index returns for the decade. Morningstar assigned Facebook a wide economic moat rating out of the gate when it went public in May 2012 and cites its network effect around its massive user base and intangible assets related to user data.
While FB’s stock price has certainly trended up since its IPO, it hasn’t been without volatility. The key to the Moat Index’s allocations to FB has been its focus on valuations. Each instance of exposure to FB in the Moat Index began with attractive valuations and ultimately concluded with outperformance of the broad market.
*Facebook was added to the U.S. Moat Index in September 2018 and its position was subsequently increased at the December 2018 review. It remains in the index and returns are for these positions are displayed though December, 31, 2019. Source: Morningstar. Past performance is no guarantee of future results. For illustrative purposes only. Not a recommendation to buy or sell any security. Visit vaneck.com to view daily ETF and index holdings.
While not all companies contribute to Moat Index returns the way these three tech companies have in 2019, far more have contributed positively than have detracted from performance. Information technology was the top contributing sector to both Moat Index performance and that of the broad U.S. equity markets for the year. But other sectors also stood out in the Moat Index such as health care, consumer staples and financials. Even smaller sectors such as materials contributed meaningfully to its performance during the year, far more so than in the broad market.
Top and Bottom Contributors to 2019 Moat Index Return (%)
|
Top 10 |
Bottom 10 |
||||
|
Name |
Ticker |
Contribution |
Name |
Ticker |
Contribution |
|
KLA Corp |
KLAC |
2.16 |
Core Laboratories |
CLB |
-0.66 |
|
Applied Materials Inc |
AMAT |
1.72 |
Cheniere Energy Inc |
LNG |
-0.21 |
|
Facebook Inc |
FB |
1.28 |
Veeva Systems Inc |
VEEV |
-0.13 |
|
The Western Union Co |
WU |
1.27 |
Pfizer Inc |
PFE |
-0.07 |
|
Microchip Technology Inc |
MCHP |
1.17 |
Harley-Davidson Inc |
HOG |
0.09 |
|
Campbell Soup Co |
CPB |
1.17 |
Cerner Corp |
CERN |
0.12 |
|
Compass Minerals International |
CMP |
1.12 |
John Wiley & Sons Inc |
JWA |
0.13 |
|
General Mills Inc |
GIS |
1.12 |
Berkshire Hathaway Inc |
BRKB |
0.14 |
|
Zimmer Biomet Holdings Inc |
ZBH |
1.08 |
Merck & Co Inc |
MRK |
0.14 |
|
State Street Corporation |
STT |
1.00 |
General Dynamics Corp |
GD |
0.15 |
Source: Morningstar. Past performance is no guarantee of future results. For illustrative purposes only. Not a recommendation to buy or sell any security. Visit vaneck.com to view daily ETF and index holdings.
Important Disclosures
The information presented does not involve the rendering of personalized investment, financial, legal, or tax advice. Certain statements contained herein may constitute projections, forecasts and other forward looking statements, which do not reflect actual results, are valid as of the date of this communication and subject to change without notice. Information provided by third party sources are believed to be reliable and have not been independently verified for accuracy or completeness and cannot be guaranteed. The information herein represents the opinion of the author(s), but not necessarily those of VanEck.
This commentary is not intended as a recommendation to buy or to sell any of the sectors or securities mentioned herein. Holdings will vary for the MOAT ETF and its corresponding Index. For a complete list of holdings in the ETF, please click here: https://www.vaneck.com/etf/equity/moat/holdings/
An investor cannot invest directly in an index. Returns reflect past performance and do not guarantee future results. Results reflect the reinvestment of dividends and capital gains, if any. Certain indices may take into account withholding taxes. Index returns do not represent Fund returns. The Index does not charge management fees or brokerage expenses, nor does the Index lend securities, and no revenues from securities lending were added to the performance shown.
Fair value estimate: the Morningstar analyst's estimate of what a stock is worth.
Price/Fair Value: ratio of a stock's trading price to its fair value estimate.
The Morningstar® Wide Moat Focus IndexSM was created and is maintained by Morningstar, Inc. Morningstar, Inc. does not sponsor, endorse, issue, sell, or promote the VanEck Vectors Morningstar Wide Moat ETF and bears no liability with respect to that ETF or any security. Morningstar® is a registered trademark of Morningstar, Inc. Morningstar® Wide Moat Focus IndexSM is a service mark of Morningstar, Inc
The Morningstar® Wide Moat Focus IndexSM consists of U.S. companies identified as having sustainable, competitive advantages and whose stocks are attractively priced, according to Morningstar.
S&P 500® Index: consists of 500 widely held common stocks covering the leading industries of the U.S. economy.
Morningstar US Funds Large Blend Category: Average returns of U.S. funds with at least 70% of their assets comprised of domestic stocks with a mix of both growth-and value-oriented styles.
Effective June 20, 2016, Morningstar implemented several changes to the Morningstar Wide Moat Focus Index construction rules. Among other changes, the index increased its constituent count from 20 stocks to at least 40 stocks and modified its rebalance and reconstitution methodology. These changes may result in more diversified exposure, lower turnover and longer holding periods for index constituents than under the rules in effect prior to this date.
The S&P 500 Index is a product of S&P Dow Jones Indices LLC and/or its affiliates and has been licensed for use by Van Eck Associates Corporation. Copyright ©2019 S&P Dow Jones Indices LLC, a division of S&P Global, Inc., and/or its affiliates. All rights reserved. Redistribution or reproduction in whole or in part are prohibited without written permission of S&P Dow Jones Indices LLC. For more information on any of S&P Dow Jones Indices LLC’s indices please visit www.spdji.com. S&P® is a registered trademark of S&P Global and Dow Jones®is a registered trademark of Dow Jones Trademark Holdings LLC. Neither S&P Dow Jones Indices LLC, Dow Jones Trademark Holdings LLC, their affiliates nor their third party licensors make any representation or warranty, express or implied, as to the ability of any index to accurately represent the asset class or market sector that it purports to represent and neither S&P Dow Jones Indices LLC, Dow Jones Trademark Holdings LLC, their affiliates nor their third party licensors shall have any liability for any errors, omissions, or interruptions of any index or the data included therein.
An investment in the VanEck Vectors Morningstar Wide Moat ETF (MOAT®) may be subject to risks which include, among others, investing in the health care, consumer discretionary, industrials, financial services sectors, medium-capitalization companies, equity securities, market, operational, index tracking, authorized participant concentration, no guarantee of active trading market, trading issues, passive management, fund shares trading, premium/discount risk and liquidity of fund shares, non-diversified, and concentration risks, which may make these investments volatile in price or difficult to trade. Medium-capitalization companies may be subject to elevated risks.
Fund shares are not individually redeemable and will be issued and redeemed at their net asset value (NAV) only through certain authorized broker-dealers in large, specified blocks of shares called "creation units" and otherwise can be bought and sold only through exchange trading. Shares may trade at a premium or discount to their NAV in the secondary market. You will incur brokerage expenses when trading Fund shares in the secondary market. Past performance is no guarantee of future results.
Investing involves substantial risk and high volatility, including possible loss of principal. An investor should consider a Fund's investment objective, risks, charges and expenses carefully before investing. To obtain a prospectus and summary prospectus for VanEck Funds and VanEck Vectors ETFs, which contain this and other information, call 800.826.2333 or visit vaneck.com. Please read the prospectus and summary prospectus for VanEck Funds and VanEck Vectors ETFs carefully before investing.
Related Insights


Related Insights
April 10, 2024