Vaneck Crypto Newsletter January 2023 – Chasing New Narratives
21 February 2023
- Chasing New Narratives
- Why Ethereum Bulls are Turning to LSD
- National Australia Bank Creates Stablecoin Called AUDN: AFR
- Bitcoin Mining Difficulty Hits a New All-Time High
- MVRV Ratio Showing Early Bull Market Signs
- First Time in 2023 to Hit Higher Unrealized Profits Relative to Losses
Chasing New Narratives
Now that the dust has settled after several bankruptcies, scams, and hacks have mostly resolved, the weeds of crypto have been removed and the people are looking for their next harvest. I am referring to the act of chasing narratives. This is something that seems common at the depths of a bear market, just at the moment when we are transitioning from capitulation to hope (on-chain data provides evidence of this, see graphs below).
So what are some new narratives that I am currently seeing in this market? I see significant movement towards the tokenization of real-world assets. DeFi is looking for more sustainable yields, and one way to enable that is to tap into the yields of the real-world economy such as real estate.
For example, an Investment DAO, is a type of DAO that allows a group of pseudo-anonymous individuals to cooperatively make investments into literally anything of value, either algorithmically or through decentralized voting. A good example of this is MakerDAO, the governing body of the Maker Protocol, investing $500 million into the US treasuries and corporate bonds in October 2022. This decision was made through their governance model, where MKR token holders can vote on proposals such as this one.
How does this asset allocation work in practice? MakerDAO is currently not registered in any jurisdiction and is therefore not its entity. However, they can rely on counterparties to do so. The final investment solution can be voted upon by the MKR token holders, providing decentralized governance and transparency throughout the whole process. It is likely that we will see other DeFi protocols attempt to get exposure to real-world assets as regulations and guidelines are set.
Other Real-World Asset lending protocols include TrueFi (TRU), Maple Finance, Goldfinch (GFI) and Centirfue (CFG). All lending protocols combined have a total sum of $326 million in active loans.*
Another narrative is new Layer-1’s (alternatives to Ethereum) capturing network share. While Ethereum has what others don’t (yet) have, network effect, other blockchains are trying to get an edge by being faster, more developer friendly or more incentivized. This year will likely wash out many new layers 1’s, especially if we remain going sideways in terms of market capitalization and network revenue.
Let’s not forget about ZK-rollups, layer-2 scaling that would enable growth unseen in the short history of crypto (the infamous claim of 100.000 TPS of Vitalik Buterin). Which ones will play out the way the narrative suggests remains to be discovered, stay with us for upcoming editions of the monthly newsletter.
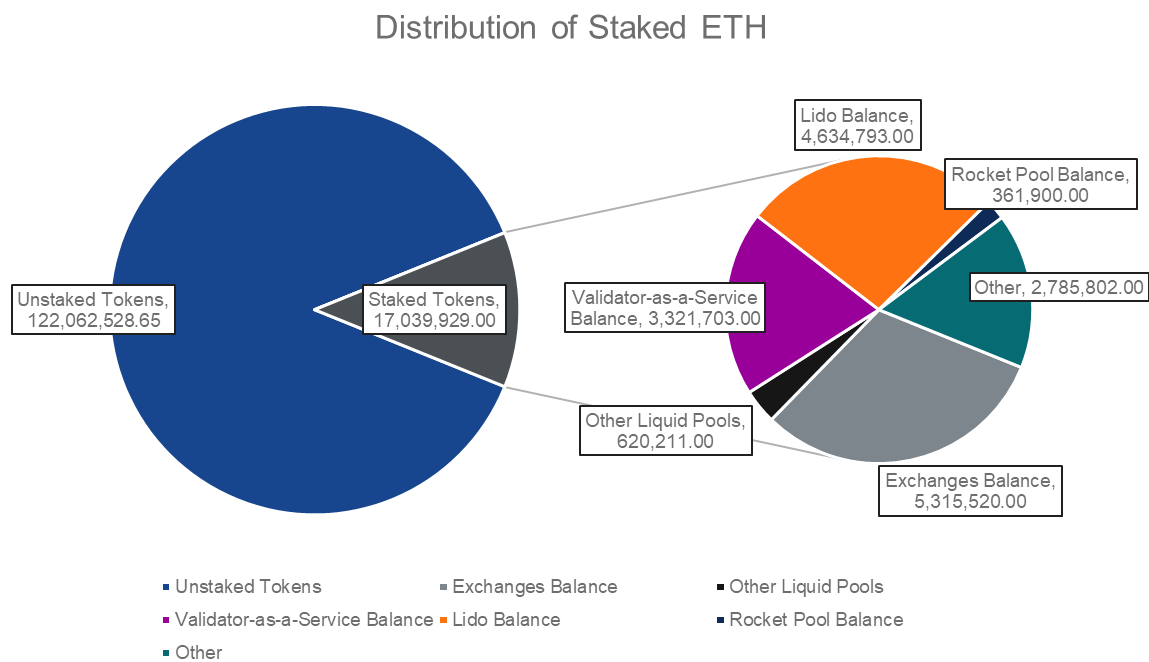
Why Ethereum Bulls are Turning to LSD
Before any further confusion commences, LSD stands for Liquid Staking Derivative. LSDs are derivatives based on staked tokens (such as ETH) but are liquid, unlike staked tokens. In exchange, LSDs yield only partial staking rewards to compensate for the increased risk of the LSD issuer. The tokens behind projects like Lido Finance (up 50.3%) and Rocket Pool (up 23.3%) have soared over the last few days. The reason? Ethereum developers are rolling up their sleeves ahead of a key upgrade to the network: Shanghai.
But first, what are LSDs and why are so hyped? Liquid staking derivatives (LSDs) like Lido Finance, Ankr and Rocket Pool have emerged as one of the hottest new trends in the DeFi world, enabling investors to maximize their earnings potential by validating transactions for the Ethereum network without giving up liquidity.
What does that have to do with Ethereum’s Shanghai update?
Until now, many investors have been reluctant to invest in Ethereum or into staking ventures due to the uncertainty about when and how funds can be un-staked. When funds are staked, it usually means that funds are locked for a defined amount of time. Since the deployment of the Beacon Chain (the Proof-of-stake chain), no one could tell you exactly when you could get your funds back. Ethereum’s Shanghai upgrade is a hard fork slated for March 2023. One of the biggest developments associated with the fork is that it will enable stakers and validators to withdraw assets from the Beacon Chain.
Around the time of the update, we expect the market will be more volatile than usual, as well as a minor disturbance in the network during the hard fork. We also believe that this will positively affect the sentiment towards Ethereum, increasing the staking ratio, therefore decreasing the liquid supply and selling pressure over time.
National Australia Bank Creates Stablecoin Called AUDN: AFR
The stablecoin will launch on the Ethereum network and Algorand blockchain, a smart contract platform similar to Ethereum. NAB plans to launch the stablecoin sometime in mid-year.
It intends to provide users with settlement in real-time by using a 1:1 Australian dollar-backed token. The value of the stablecoin is therefore dependent on the asset class it is pegged to. According to the NAB’s chief innovation officer, AUDN’s applications could range further to carbon credit trading and overseas money transfers such as remittance payments and repurchase agreements.
This development in particular is interesting because of the history of cryptocurrencies. The original cryptocurrencies, back in the 1980s, were designed to circumvent the limits of banks and increase the anonymity of payments. Bitcoin is no different, its value is not pegged to anything in particular and it allows anyone to conduct transactions without centralised intermediaries. After over 10 years of innovation in cryptocurrencies, we arrived at cryptocurrencies designed, maintained and guarded by banks. This might be a sign that even banks strongly believe cryptocurrencies, especially network such as Ethereum and Algorand and their native tokens are here to stay.
Bitcoin Mining Difficulty Hits a New All-Time High
A new record has been set for Bitcoin's mining difficulty, which increased by around 4.68% from 37.59 trillion on Sunday to 39.35 trillion at the time of writing.
The measure of the amount of processing power needed to mine one bitcoin is called the mining difficulty. Every two weeks or so, it is changed, becoming harder as more miners join the network and easier as they leave.
The difficulty of mining bitcoin during the past month. From CryptoQuant. Despite brief reductions, like in December 2022, mining difficulty has been increasing significantly and continuously throughout the past year.
According to data from CryptoQuant, the mining difficulty was 26.24 EH/s on January 30, 2022, but it has since increased to 39.35 EH/s, a roughly 50% increase.
The hash rate of Bitcoin, which gauges the amount of processing power devoted to cryptocurrency mining, is currently 305.81 ExaHashes per second (EH/s). This number is still less than the record high of 348.7 EH/S set on January 6.
According to the current hash rate, Bitcoin miners are currently attempting to crack approximately 305 quintillion codes every second to perform the proof-of-work (PoW) for decentralized consensus.
What does this mean for miners and Bitcoin?
It is not particularly good news, a higher hash rate means that it becomes less profitable or even not profitable at all depending on where you get your electricity from. If the Bitcoin price does not catch up, miners will not be able to keep going much longer and more bankruptcies among mining companies may follow. At the same time, energy prices seem to be returning to normality while Bitcoin’s price has been rising consistently over January (+39%). Miners are not out of the woods yet.
MVRV Ratio Showing Early Bull Market Signs
MVRV ratio turning positive has previously been observed before significant growth in value in early 2020, early 2019 and late 2015. In other words, a value below 1 suggests that the exchange-traded price of Bitcoin is at a discount compared to the realized price. We are currently trading at an MVRV ratio of 1 which suggests fair value and can be considered a post-bottom sign.
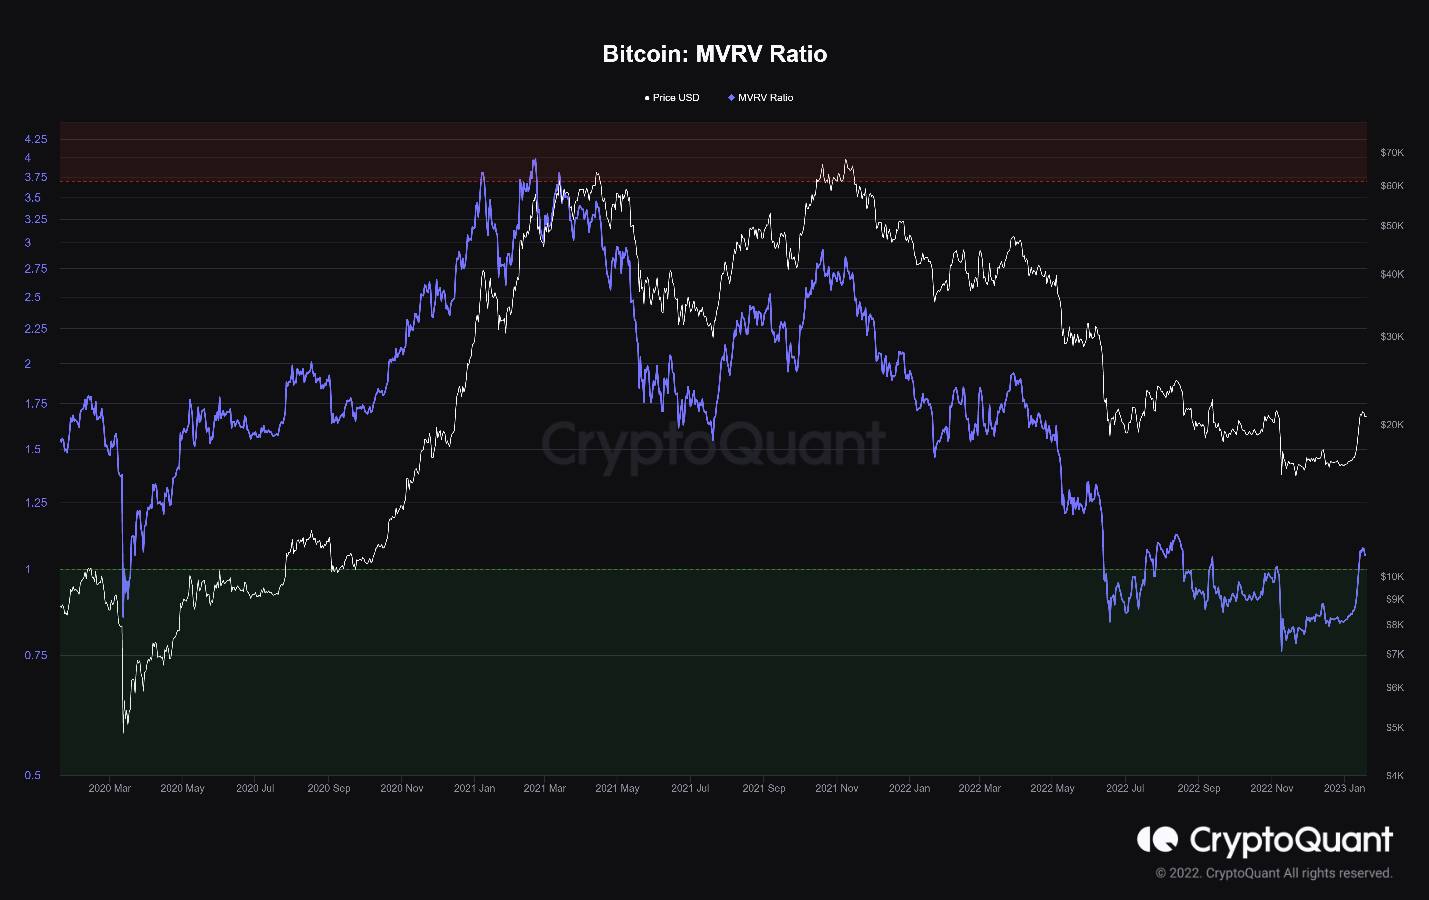
MVRV is the ratio comparing the two, i.e. MVRV = Market Cap / Realised Cap. It’s useful for understanding if the exchange traded price is below “fair value” and is also quite useful for spotting market tops and bottoms.
First Time in 2023 to Hit Higher Unrealized Profits Relative to Losses
At the height of the previous bull market, the ratio of investors who were in profit was at its highest level. A high NUPL value also suggests high potential selling pressure, also associated with the phase of euphoria/greed. As the NUPL recently turned positive, it suggests a change in sentiment from capitulation (negative NUPL) to hope (slightly positive NUPL).
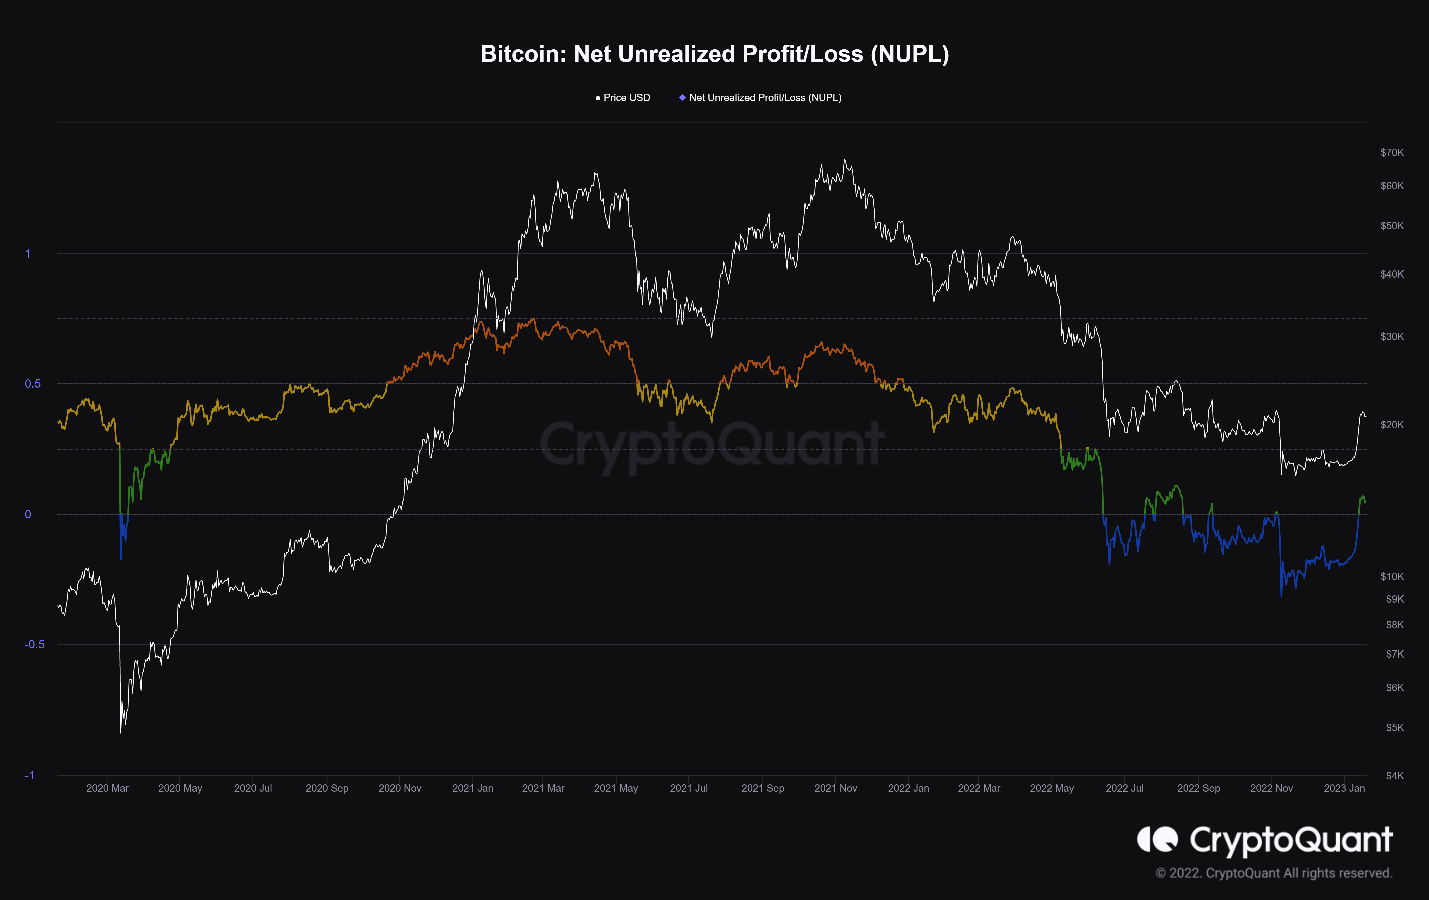
Net Unrealized Profit and Loss (NUPL) is the difference between market cap and realized cap divided by market cap.
Assuming that the latest coin movement is the result of a purchase, NUPL indicates the total amount of profit/loss in all the coins represented as a ratio.
It could be interpreted as the ratio of investors who are in profit.
We publish this newsletter to inform and educate about recent market developments and technological updates, not to give any recommendation for certain products or projects. The selection of articles should therefore not be understood as financial advice or recommendation for any specific product and/or digital asset. We may occasionally include analysis of past market, network performance expectations and/or on-chain performance. Historical performance is not indicative for future returns.
* Source: https://twitter.com/DefiIgnas/status/1617800035684732928
ETN Disclaimer
Important information
For informational and advertising purposes only.
This information originates from VanEck (Europe) GmbH, Kreuznacher Straße 30, 60486 Frankfurt am Main. It is intended only to provide general and preliminary information to investors and shall not be construed as investment, legal or tax advice. VanEck (Europe) GmbH and its associated and affiliated companies (together “VanEck”) assume no liability with regards to any investment, divestment or retention decision taken by the investor on the basis of this information. Views and opinions expressed are current as of the date of this information and are subject to change with market conditions. Certain statements contained herein may constitute projections, forecasts and other forward looking statements, which do not reflect actual results. VanEck makes no representation or warranty, express or implied regarding the advisability of investing in securities or digital assets generally or in the product mentioned in this information (the “Product”) or the ability of the underlying Index to track the performance of the relevant digital assets market.
The underlying Index is the exclusive property of MarketVector Indexes GmbH, which has contracted with CryptoCompare Data Limited to maintain and calculate the Index. CryptoCompare Data Limited uses its best efforts to ensure that the Index is calculated correctly. Irrespective of its obligations towards the MarketVector Indexes GmbH, CryptoCompare Data Limited has no obligation to point out errors in the Index to third parties.
Investing is subject to risk, including the possible loss of principal up to the entire invested amount and the extreme volatility that ETNs experience. You must read the prospectus and KID before investing, in order to fully understand the potential risks and rewards associated with the decision to invest in the Product. The approved Prospectus is available at www.vaneck.com. Please note that the approval of the prospectus should not be understood as an endorsement of the Products offered or admitted to trading on a regulated market.
Performance quoted represents past performance, which is no guarantee of future results and which may be lower or higher than current performance.
Current performance may be lower or higher than average annual returns shown. Performance shows 12 month performance to the most recent Quarter end for each of the last 5yrs where available. E.g. '1st year' shows the most recent of these 12-month periods and '2nd year' shows the previous 12 month period and so on. Performance data is displayed in Base Currency terms, with net income reinvested, net of fees. Brokerage or transaction fees will apply. Investment return and the principal value of an investment will fluctuate. Notes may be worth more or less than their original cost when redeemed.
Index returns are not ETN returns and do not reflect any management fees or brokerage expenses. An index’s performance is not illustrative of the ETN’s performance. Investors cannot invest directly in the Index. Indices are not securities in which investments can be made.
No part of this material may be reproduced in any form, or referred to in any other publication, without express written permission of VanEck.
© VanEck (Europe) GmbH
Important Disclosure
This is a marketing communication. Please refer to the prospectus of the UCITS and to the KID before making any final investment decisions.
This information originates from VanEck (Europe) GmbH, which has been appointed as distributor of VanEck products in Europe by the Management Company VanEck Asset Management B.V., incorporated under Dutch law and registered with the Dutch Authority for the Financial Markets (AFM). VanEck (Europe) GmbH with registered address at Kreuznacher Str. 30, 60486 Frankfurt, Germany, is a financial services provider regulated by the Federal Financial Supervisory Authority in Germany (BaFin).
The information is intended only to provide general and preliminary information to investors and shall not be construed as investment, legal or tax advice VanEck (Europe) GmbH, VanEck Switzerland AG, VanEck Securities UK Limited and their associated and affiliated companies (together “VanEck”) assume no liability with regards to any investment, divestment or retention decision taken by the investor on the basis of this information. The views and opinions expressed are those of the author(s) but not necessarily those of VanEck. Opinions are current as of the publication date and are subject to change with market conditions. Certain statements contained herein may constitute projections, forecasts and other forward-looking statements, which do not reflect actual results. Information provided by third party sources is believed to be reliable and have not been independently verified for accuracy or completeness and cannot be guaranteed. Brokerage or transaction fees may apply.
All performance information is based on historical data and does not predict future returns. Investing is subject to risk, including the possible loss of principal.
No part of this material may be reproduced in any form, or referred to in any other publication, without express written permission of VanEck.
© VanEck (Europe) GmbH / VanEck Asset Management B.V.
Related Insights

Related Insights

26 February 2024

26 February 2024