Dividend ETF
VanEck Morningstar Developed Markets Dividend Leaders UCITS ETF
Dividend ETF
VanEck Morningstar Developed Markets Dividend Leaders UCITS ETF
Fund Description
The VanEck Morningstar Developed Markets Dividend Leaders UCITS ETF delivers an attractive regular income through equities. The Morningstar global research company seeks the top 100 income payers globally, selected for their dividend yields, resilience and likely growth.
-
NAV€38.60
as of 24 Apr 2024 -
YTD RETURNS7.09%
as of 24 Apr 2024 -
Total Net Assets€662.0 million
as of 24 Apr 2024 -
Total Expense Ratio0.38%
-
Inception Date23 May 2016
-
SFDR ClassificationArticle 8
Overview
Fund Description
The VanEck Morningstar Developed Markets Dividend Leaders UCITS ETF delivers an attractive regular income through equities. The Morningstar global research company seeks the top 100 income payers globally, selected for their dividend yields, resilience and likely growth.
- Currently provides attractive dividend income
- The top 100 developed market equities, selected for dividend yields
- Holdings screened for dividend resilience
- Globally diversified across stocks and sectors
- Screened for ESG Risks, UN Global Compact Principles Violations and controversial product involvement based on Sustainalytics research
1Not guaranteed.
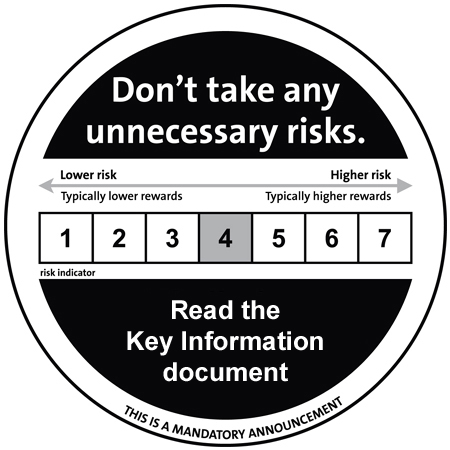
Risk Factors: Equity market risk, market risk, foreign currency risk. Please refer to the
and the Prospectus for other important information before investing.
Underlying Index
Morningstar Developed Markets Large Cap Dividend Leaders Screened Select Index (MSDMDLGE)
Fund Highlights
- Currently provides attractive dividend income
- The top 100 developed market equities, selected for dividend yields
- Holdings screened for dividend resilience
- Globally diversified across stocks and sectors
- Screened for ESG Risks, UN Global Compact Principles Violations and controversial product involvement based on Sustainalytics research
1Not guaranteed.
Risk Factors: Equity market risk, market risk, foreign currency risk. Please refer to the
and the Prospectus for other important information before investing.
Underlying Index
Morningstar Developed Markets Large Cap Dividend Leaders Screened Select Index (MSDMDLGE)
