Focusing on Valuations in a Distorted Market
September 08, 2020
Read Time 4 MIN
Less than half of S&P 500 Index constituents have posted a positive total return thus far in 2020, yet the blue chip index sits comfortably in the black with a return of 9.74% through August. Navigating a market driven by so few companies can be challenging as the so-called rich companies seem to be getting richer. A focus on valuations has long been the cornerstone of Morningstar’s moat investment philosophy, and valuations certainly seem stretched amidst the multiple global uncertainties that remain (see: global pandemic and U.S. elections).
The Morningstar® Wide Moat Focus IndexSM (the “Index”) finished August trailing the S&P 500 Index by 6% thus far in 2020 on a total return basis (3.70% vs. 9.74%, respectively). This underperformance has been largely driven by the Index’s recent positioning, which shifted following its June index review.
In June, the Index moved further away from big tech as valuations appeared stretched relative to other opportunities within Morningstar’s U.S. wide moat universe. This shift away from growth-oriented stocks has certainly contributed to the Index’s near term underperformance. Relative to the S&P 500, the Index’s underweight to big tech – namely Apple (AAPL), which features a narrow moat rating from Morningstar – has impacted returns. But other allocations within the tech sector have also affected relative returns, such as an overweight to chip companies Intel (INTC) and Microchip Technologies (MCHP) as well as insurance software company Guidewire Software (GWRE).
Stock selection in other sectors has also muted recent returns. John Wiley & Sons (JW/A), a leading academic publisher, has struggled through the global pandemic, but long-term prospects remain high according to Morningstar, who pegs the company’s stock price at a 25% discount to fair value. The high end jeweler, Tiffany & Co. (TIF), has also struggled as consumer demand dropped in the first and second quarter of the year, dampening Index returns. Its sales have bounced back slightly, and its pending acquisition by LVMH is still on track, albeit delayed. TIF remains nearly 10% undervalued, according to Morningstar. General Dynamics (GD), another leading detractor in recent months, currently sits at nearly 20% undervalued despite the defense and aerospace contractor’s rare ability to produce highly specialized products for the industry. As a long-term strategy, the Index isn’t intended to outperform over short periods of time and underperformance can and will occur. Time will tell if these attractive valuations will translate into share price appreciation.
In the near term, many investors have expressed more concern over whether certain segments of the market are far too overvalued.
Tech Sector Leads 2020 Market Returns
Much has been written on market dynamics in recent years: growth over value and the dominance of big tech and FAANG stocks are among other trends that have been highly documented. In 2020, only consumer discretionary stocks have posted returns anywhere near the tech sector through the turmoil of March and April and subsequent rebound through August.
Few Sectors Have Driven 2020 S&P 500 Index Returns (%)
As of 8/31/2020
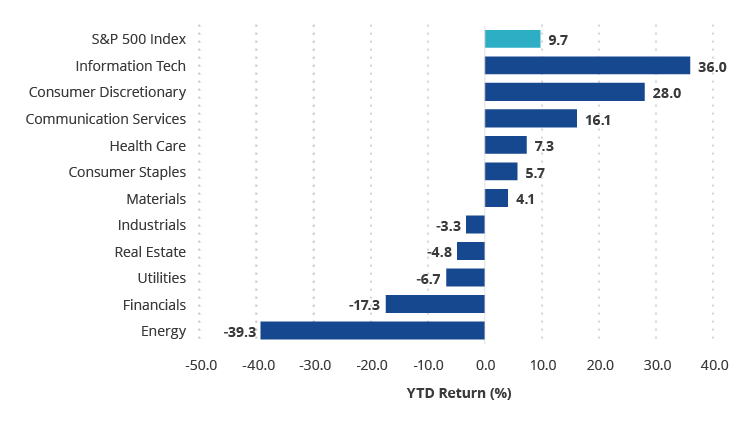
Source: Morningstar. Sector returns are represented by sector sub-indices of the S&P 500 Index. Past performance is no guarantee of future results.
With many of the largest constituents in many major market capitalization-weighted indices coming from the tech sector, there is no surprise that the sector’s influence on many investment portfolios has been profound. Tech companies currently represent approximately 28% of the S&P 500 Index weighting with health care (14%) and consumer discretionary (11%) a distant second and third place. Communications services companies, which include the likes of Facebook (FB), Google/Alphabet (GOOGL) and Netflix (NFLX) are also prominent members of the S&P 500 Index at an 11% weighting as of August 31, 2020.
One admittedly rudimentary, yet informative way of looking at 2020 U.S. market returns is to compare the market capitalization-weighted S&P 500 Index to the equal-weighted version of the S&P 500. In the equal-weighted version, the impact of big tech and other high fliers are muted, leading to negative year-to-date total return through August, a spread of over 12%.
Equal Prominence Has Resulted in Negative Returns (%)
As of 8/31/2020
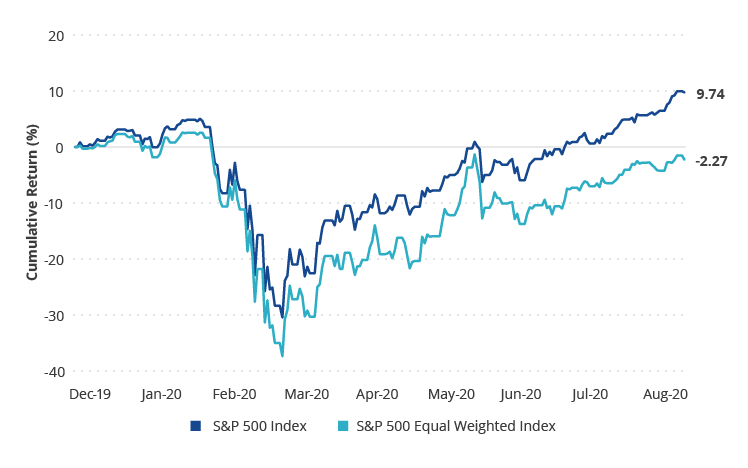
Source: Morningstar. Past performance is no guarantee of future results.
Focusing on Valuations: Are Certain Sectors Overvalued?
Market valuations have taken off in recent months. U.S. large cap stocks led by big tech have seen their shares exceed Morningstar’s estimate of fair value to, in some cases, staggering levels.
Moat Investment Philosophy Avoids Exposure to Excessive Valuations
Index Price/Fair Value Ratios
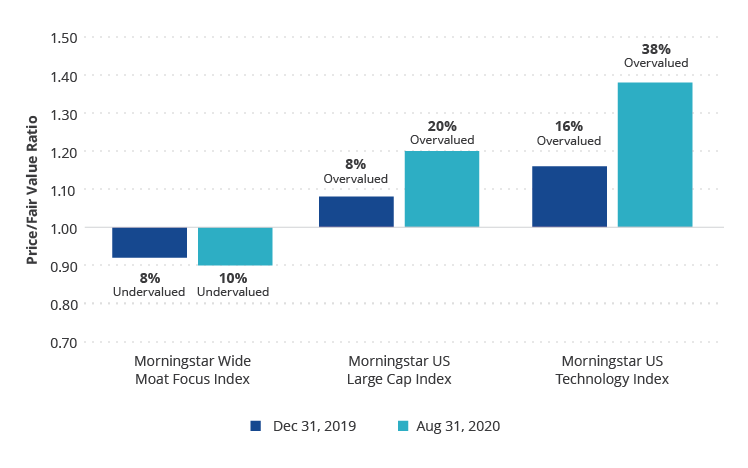
Source: Morningstar. Past performance is no guarantee of future results.
The Morningstar Wide Moat Focus Index does as its name implies: it focuses on valuation opportunities each quarter to maintain exposure to those stocks with wide economic moats and attractive entry points. Whether big tech and other growth stocks continue to provide investors compelling appreciation and also remain drivers of market returns remains to be seen. The Index’s long-term track record supports the case for a wait and see approach as the strategy navigates unprecedented macro market influences.
VanEck Vectors Morningstar Wide ETF (MOAT) seeks to replicate as closely as possible, before fees and expenses the price and yield performance of the Morningstar Wide Moat Focus Index.
For further reading:
Related Insights


Related Insights
April 10, 2024

Important Disclosures
The information presented does not involve the rendering of personalized investment, financial, legal, or tax advice. Certain statements contained herein may constitute projections, forecasts and other forward looking statements, which do not reflect actual results, are valid as of the date of this communication and subject to change without notice. Information provided by third party sources are believed to be reliable and have not been independently verified for accuracy or completeness and cannot be guaranteed. The information herein represents the opinion of the author(s), but not necessarily those of VanEck.
This commentary is not intended as a recommendation to buy or to sell any of the sectors or securities mentioned herein. Holdings will vary for the MOAT ETF and its corresponding Index. For a complete list of holdings in the ETF, please click here: https://www.vaneck.com/etf/equity/moat/holdings/.
An investor cannot invest directly in an index. Returns reflect past performance and do not guarantee future results. Results reflect the reinvestment of dividends and capital gains, if any. Certain indices may take into account withholding taxes. Index returns do not represent Fund returns. The Index does not charge management fees or brokerage expenses, nor does the Index lend securities, and no revenues from securities lending were added to the performance shown.
Fair value estimate: the Morningstar analyst's estimate of what a stock is worth.
Price/Fair Value: ratio of a stock's trading price to its fair value estimate.
The Morningstar® Wide Moat Focus IndexSM was created and is maintained by Morningstar, Inc. Morningstar, Inc. does not sponsor, endorse, issue, sell, or promote the VanEck Vectors Morningstar Wide Moat ETF and bears no liability with respect to that ETF or any security. Morningstar® is a registered trademark of Morningstar, Inc. Morningstar® Wide Moat Focus IndexSM is a service mark of Morningstar, Inc.
The Morningstar® Wide Moat Focus IndexSM consists of U.S. companies identified as having sustainable, competitive advantages and whose stocks are attractively priced, according to Morningstar.
The Morningstar US Large Cap Index tracks the performance of U.S. large-cap stocks that represent the largest 70 percent capitalization of the investable universe.
The Morningstar US Technology Index is a market capitalization-weighted index representing those companies involved in the information technology sector.
Effective June 20, 2016, Morningstar implemented several changes to the Morningstar Wide Moat Focus Index construction rules. Among other changes, the index increased its constituent count from 20 stocks to at least 40 stocks and modified its rebalance and reconstitution methodology. These changes may result in more diversified exposure, lower turnover and longer holding periods for index constituents than under the rules in effect prior to this date.
The S&P 500® Index is a product of S&P Dow Jones Indices LLC and/or its affiliates and has been licensed for use by Van Eck Associates Corporation. Copyright ©2020 S&P Dow Jones Indices LLC, a division of S&P Global, Inc., and/or its affiliates. All rights reserved. Redistribution or reproduction in whole or in part are prohibited without written permission of S&P Dow Jones Indices LLC. For more information on any of S&P Dow Jones Indices LLC’s indices please visit www.spdji.com. S&P® is a registered trademark of S&P Global and Dow Jones® is a registered trademark of Dow Jones Trademark Holdings LLC. Neither S&P Dow Jones Indices LLC, Dow Jones Trademark Holdings LLC, their affiliates nor their third party licensors make any representation or warranty, express or implied, as to the ability of any index to accurately represent the asset class or market sector that it purports to represent and neither S&P Dow Jones Indices LLC, Dow Jones Trademark Holdings LLC, their affiliates nor their third party licensors shall have any liability for any errors, omissions, or interruptions of any index or the data included therein.
An investment in the VanEck Vectors Morningstar Wide Moat ETF (MOAT®) may be subject to risks which include, among others, investing in equity securities, consumer discretionary, financials, health care, industrials and information technology sectors, medium-capitalization companies, market, operational, index tracking, authorized participant concentration, no guarantee of active trading market, trading issues, passive management, fund shares trading, premium/discount risk and liquidity of fund shares, non-diversified, and concentration risks, which may make these investments volatile in price or difficult to trade. Medium-capitalization companies may be subject to elevated risks.
Investing involves substantial risk and high volatility, including possible loss of principal. An investor should consider a Fund's investment objective, risks, charges and expenses carefully before investing. To obtain a prospectus and summary prospectus for VanEck Funds and VanEck Vectors ETFs, which contain this and other information, call 800.826.2333 or visit vaneck.com. Please read the prospectus and summary prospectus for VanEck Funds and VanEck Vectors ETFs carefully before investing.
Related Funds
Important Disclosures
The information presented does not involve the rendering of personalized investment, financial, legal, or tax advice. Certain statements contained herein may constitute projections, forecasts and other forward looking statements, which do not reflect actual results, are valid as of the date of this communication and subject to change without notice. Information provided by third party sources are believed to be reliable and have not been independently verified for accuracy or completeness and cannot be guaranteed. The information herein represents the opinion of the author(s), but not necessarily those of VanEck.
This commentary is not intended as a recommendation to buy or to sell any of the sectors or securities mentioned herein. Holdings will vary for the MOAT ETF and its corresponding Index. For a complete list of holdings in the ETF, please click here: https://www.vaneck.com/etf/equity/moat/holdings/.
An investor cannot invest directly in an index. Returns reflect past performance and do not guarantee future results. Results reflect the reinvestment of dividends and capital gains, if any. Certain indices may take into account withholding taxes. Index returns do not represent Fund returns. The Index does not charge management fees or brokerage expenses, nor does the Index lend securities, and no revenues from securities lending were added to the performance shown.
Fair value estimate: the Morningstar analyst's estimate of what a stock is worth.
Price/Fair Value: ratio of a stock's trading price to its fair value estimate.
The Morningstar® Wide Moat Focus IndexSM was created and is maintained by Morningstar, Inc. Morningstar, Inc. does not sponsor, endorse, issue, sell, or promote the VanEck Vectors Morningstar Wide Moat ETF and bears no liability with respect to that ETF or any security. Morningstar® is a registered trademark of Morningstar, Inc. Morningstar® Wide Moat Focus IndexSM is a service mark of Morningstar, Inc.
The Morningstar® Wide Moat Focus IndexSM consists of U.S. companies identified as having sustainable, competitive advantages and whose stocks are attractively priced, according to Morningstar.
The Morningstar US Large Cap Index tracks the performance of U.S. large-cap stocks that represent the largest 70 percent capitalization of the investable universe.
The Morningstar US Technology Index is a market capitalization-weighted index representing those companies involved in the information technology sector.
Effective June 20, 2016, Morningstar implemented several changes to the Morningstar Wide Moat Focus Index construction rules. Among other changes, the index increased its constituent count from 20 stocks to at least 40 stocks and modified its rebalance and reconstitution methodology. These changes may result in more diversified exposure, lower turnover and longer holding periods for index constituents than under the rules in effect prior to this date.
The S&P 500® Index is a product of S&P Dow Jones Indices LLC and/or its affiliates and has been licensed for use by Van Eck Associates Corporation. Copyright ©2020 S&P Dow Jones Indices LLC, a division of S&P Global, Inc., and/or its affiliates. All rights reserved. Redistribution or reproduction in whole or in part are prohibited without written permission of S&P Dow Jones Indices LLC. For more information on any of S&P Dow Jones Indices LLC’s indices please visit www.spdji.com. S&P® is a registered trademark of S&P Global and Dow Jones® is a registered trademark of Dow Jones Trademark Holdings LLC. Neither S&P Dow Jones Indices LLC, Dow Jones Trademark Holdings LLC, their affiliates nor their third party licensors make any representation or warranty, express or implied, as to the ability of any index to accurately represent the asset class or market sector that it purports to represent and neither S&P Dow Jones Indices LLC, Dow Jones Trademark Holdings LLC, their affiliates nor their third party licensors shall have any liability for any errors, omissions, or interruptions of any index or the data included therein.
An investment in the VanEck Vectors Morningstar Wide Moat ETF (MOAT®) may be subject to risks which include, among others, investing in equity securities, consumer discretionary, financials, health care, industrials and information technology sectors, medium-capitalization companies, market, operational, index tracking, authorized participant concentration, no guarantee of active trading market, trading issues, passive management, fund shares trading, premium/discount risk and liquidity of fund shares, non-diversified, and concentration risks, which may make these investments volatile in price or difficult to trade. Medium-capitalization companies may be subject to elevated risks.
Investing involves substantial risk and high volatility, including possible loss of principal. An investor should consider a Fund's investment objective, risks, charges and expenses carefully before investing. To obtain a prospectus and summary prospectus for VanEck Funds and VanEck Vectors ETFs, which contain this and other information, call 800.826.2333 or visit vaneck.com. Please read the prospectus and summary prospectus for VanEck Funds and VanEck Vectors ETFs carefully before investing.