25 Top Tokens May Be Commodities, VanEck Analysis Reveals
06 July 2023
Please note that VanEck may have a position(s) in the digital asset(s) described below.
Digital assets price dispersion reached extreme levels in June as Bitcoin gained 12% while every crypto sector we track fell in the month. Two principal events catalyzed the performance gap, in our view. First, on June 2nd, Patrick McHenry, Chairman of the House Financial Services Committee, released the Digital Asset Market Structure Proposal to establish clear guidelines for cryptocurrencies to be classified as either a security or commodity. Then, on June 5th and 6th, the SEC sued Binance and Coinbase, respectively, alleging that both operated as unregistered national securities exchanges and brokerages, that Binance commingled customer assets and named at least 13 crypto assets made available to customers that qualify as "crypto asset securities."
| June | YTD | |
| Coinbase | 15% | 101% |
| BTC | 12% | 83% |
| Nasdaq | 7% | 32% |
| S&P | 6% | 16% |
| ETH | 3% | 61% |
| MarketVectorTM Decentralized Finance Leaders Index | 1% | 29% |
| MarketVectorTM Smart Contract Leaders Index | -8% | 28% |
| MarketVectorTM Infrastructure Application Leaders Index | -15% | 26% |
| MarketVectorTM Centralized Exchanges Index | -20% | 0% |
| MarketVectorTM Media & Entertainment Leaders Index | -22% | -12% |
Source: Bloomberg, MarketVector, VanEck research as of 6/30/2023. Past performance is not indicative of future results. Not a recommendation to buy or sell any of the names mentioned herein.
AltSeason - % Assets Outperforming BTC 90 Day Return
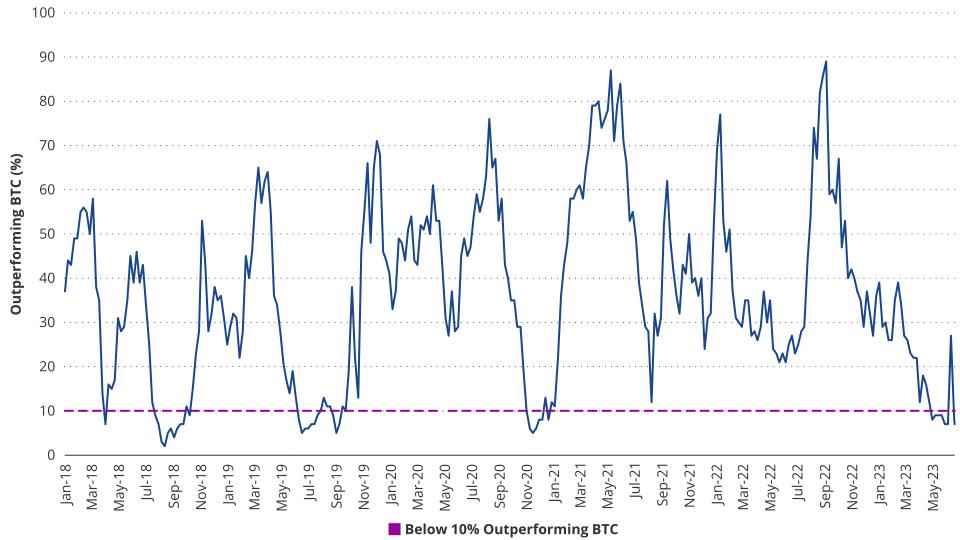
Source: Coingecko as of 6/30/2023. Past performance is no guarantee of future results. Not intended as a recommendation to buy or sell any securities named herein. Index performance is not representative of fund performance. It is not possible to invest directly in an index.
These legislative and judicial clarifications are important because blockchains whose tokens are classified as securities under US law may struggle to attract developers, many of whom expect censorship resistance and decentralization. Indeed, several exchanges and market makers delisted some of the 13 coins named in the SEC suits, including large-caps Solana, Cardano, and Polygon, all of which fell more than 20% in June. Further illustrating the potential market share losses by “security” token projects, the ratio of open-source “commits” in the Ethereum ecosystem made a 12-month high relative to competing smart contract platforms, even as overall open-source blockchain developer activity plunged to yearly lows.
Total Smart Contract Platform Ecosystem GitHub Commits
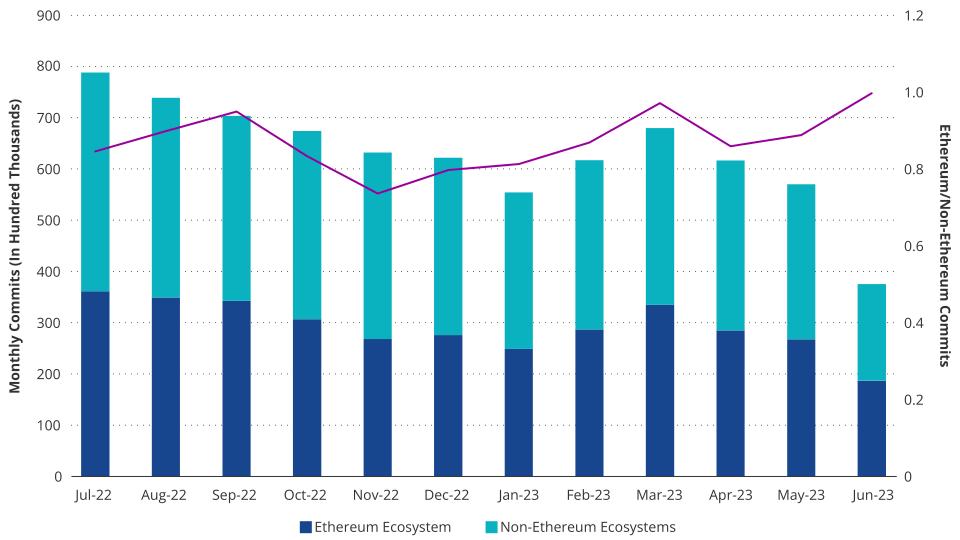
Source: Github as of 6/30/2023. Past performance is no guarantee of future results. Not intended as a recommendation to buy or sell any securities named herein.
Analyzing the House Financial Services’ Digital Asset Market Structure Proposal
Many open-source blockchain project participants have argued that decentralization is not binary but a spectrum comprising a handful of fluid factors, including network architexture, team makeup, and tokenomics. But the spectrum claim only applies until one faces a lawsuit. At this point, more specific distinctions are acquired. With that in mind, we took a close look at the House Financial Services’ Digital Assets Market Structure Proposal, proposed legislation which posits that if a token meets the four guidelines below, the digital asset can be considered ‘sufficiently decentralized’ and fall under the CFTC’s oversight as a digital commodity.
No issuer or affiliated persons can prevent anyone from using the digital asset or operating computational infrastructure related to the blockchain network (applies to the past 12 months)
No issuer or affiliated person owns or has voting rights to 20% or more of the circulating supply (past 12 months, excludes fully decentralized DAOS)
No issuer or affiliated person has marketed to the public the digital asset or blockchain network (past 3 months)
All issuances of digital assets have been end-user distributions (past 12 months)
To clarify the legal jargon regarding the first stipulation, we interpret computational infrastructure as applied to operating nodes, validators, or anything related to blockchain architexture that requires hardware. An affiliated person is anyone who directly or indirectly controls 5% or more of the circulating supply. End User distributions refer to the process of how tokens are issued or earned. Essentially, tokens must be distributed in a non-discretionary manner that can be satisfied by any participant in the network for activities directly related to the operation of the network. This means absolutely no exchange of cash or other assets in exchange for the token.
In response to the proposed legislation, we applied these guidelines to classify the top 100 tokens by market cap as either securities or commodities. We excluded stablecoins and did not consider the marketing rule since the courts could argue that any network with a Twitter account is ‘marketing.’ From our analysis, just 25 of the top 100 tokens could potentially be considered ‘sufficiently decentralized’ to avoid the disclosure requirements of the proposed law.
We then analyzed the simple average and market-cap-weighted returns for the 30- and 365-days ending on June 28th. The data reveal a clear pattern: tokens classified as 'sufficiently decentralized' digital commodities exhibit superior returns and lower volatility, particularly when weighted by their market cap. We are happy to share our specific token analysis upon request.
| Token Classification | Digital Commodity | Digital Security | Digital Commodity (ex- BTC/ETH) |
| Avg 30 day Return | -2% | -12% | -3% |
| Market Weighted 30 day Return | 7% | -13% | 15% |
| Avg 365 day Return | 9% | 21% | 4% |
| Market Weighted 365 day Return | 50% | 7% | 33% |
| Annualized volatility | 89% | 95% | 92% |
| Market Weighted Annualized Volatility | 59% | 78% | 91% |
Source: VanEck as of 6/28/2023. Past performance is no guarantee of future results. Not intended as a recommendation to buy or sell any securities named herein.
Layer 1s June 2023 Performance Overview: Best and Worst Tokens
For the fourth consecutive year, the “June Witch” emerged from the swirling waters of the cryptocurrency markets and “rekt” countless financial mariners. After the melee and subsequent decline in meme coin trading in May, June began with record low crypto volatility as Bitcoin’s implied vol sunk into the high 20s, on par. As is typical in the space, that lull did not last long, and by June 15ththe total market cap of all layer 1s smart contract platforms (SCPs) had fallen 16% to $289B. After that, the market recovered somewhat, thanks to momentum generated by Blackrock Bitcoin ETF filing, but SCPs still ended the month down 6%. For June, the best-performing tokens were Arbitrum (+3%), ETH (+3%), and Polkadot (-4%). On the flipside, Polygon (-26%), Cardano (-26%), and Matic (-26%) fell the most.
SCP June Monthly Returns: 2020 - 2023
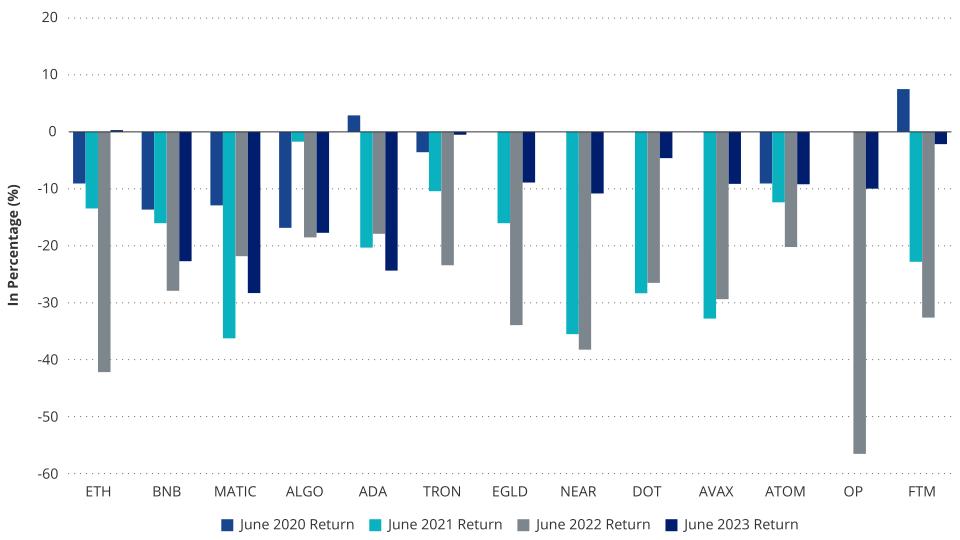
Source: Artemis.xyz as of 6/30/2023. Past performance is no guarantee of future results. Not intended as a recommendation to buy or sell any securities named herein.
Arbitrum
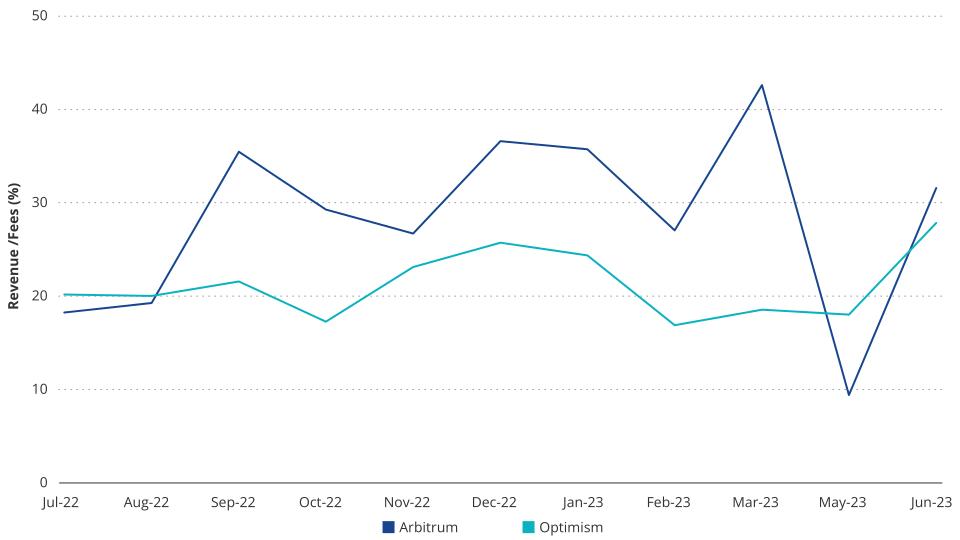
Arbitrum set a new high with 2.7 million monthly unique active addresses, becoming so popular that the chain for an hour on June 7th. The halt occurred when the centrally controlled sequencer ran out of ETH necessary to pay the gas fees required to post updates to Ethereum. Whether due to increased user traffic or a lack of oversight from the team, the halt was negligible, and Arbitrum experienced one of its most profitable months to date, with monthly profits of +38% to $1.29M, even as revenues (fees paid by users) declined by 54%. This is an interesting dynamic that relates to how Layer-2s business economics work. Layer-2s host separate transaction environments from Ethereum. Applications and value, in the form of tokens, operate on the L2s, and the L2s then post the history of activity to Ethereum. Because most blockchains tend to experience usership at the same time, revenues and profits for L2s can diverge. While revenues may increase because of increased activity on an L2, profit margins and even total profits can decrease. That is because the main cost to L2s, posting to Ethereum, can also increase substantially with more activity on Ethereum. In the month of June, gas fees on Ethereum were lower due to decreased activity, so the profit margins of L2 should logically increase, all else equal, because their main cost of revenue has declined. However, Arbitrum did not just have higher profit margins in June; they actually saw profits increase, meaning that the margin surge more than compensated for the decrease in revenues. This implies that there was high demand for users to transact on Arbitrum. On a relative basis, Arbitrum distinguished itself as a hub of activity versus its main competitor, Optimism. Optimism's profits and revenues decreased by 24% and 50%, respectively.
Arbitrum vs Optimism Profit Margins
Source: Token Terminal as of 6/30/2023. Past performance is no guarantee of future results. Not intended as a recommendation to buy or sell any securities named herein.
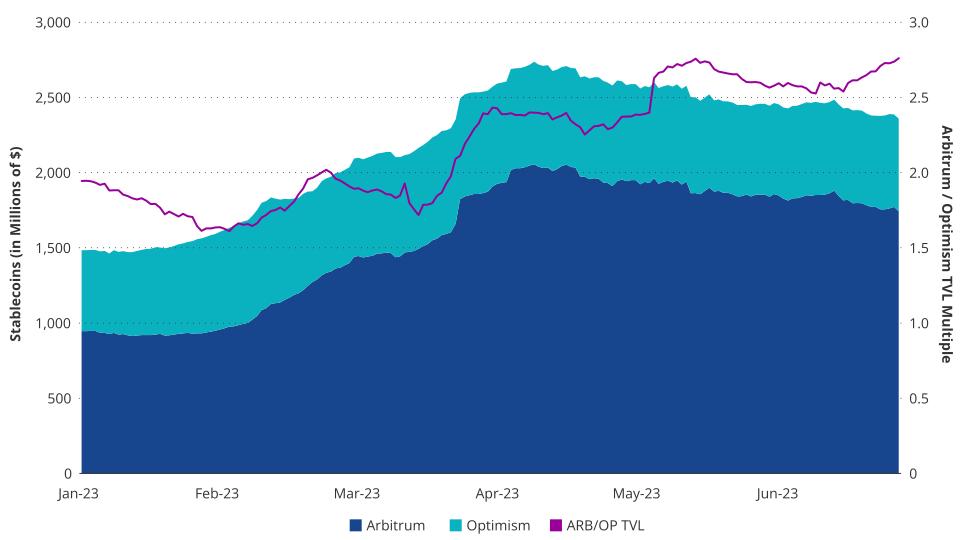
Thus, the Arbitrum ecosystem has seen a positive feedback loop, with both user base and profits rising faster than the competition. Despite announcements that Coinbase's layer 2, , and BNB chain's native layer 2, opBNB, will be built on the Optimism tech stack, Arbitrum has managed to increase its Total Value Locked (TVL) at a pace significantly faster than Optimism. While starting the year with roughly twice the TVL, it reached 3x OP’s TVL by July, thanks to a much more developed DeFi ecosystem. Popular Arbitrum-based DeFi projects GMX and Radiant have attracted roughly the same TVL as the Optimism ecosystem combined. The success of these applications in Arbitrum can be attributed to the generation of yield from substantial usage, which in turn attracts higher-value users in a positive flywheel.
Arbitrum vs Optimism Growth
Source: Artemis.xyz as of 6/30/2023. Past performance is no guarantee of future results. Not intended as a recommendation to buy or sell any securities named herein.
Ethereum
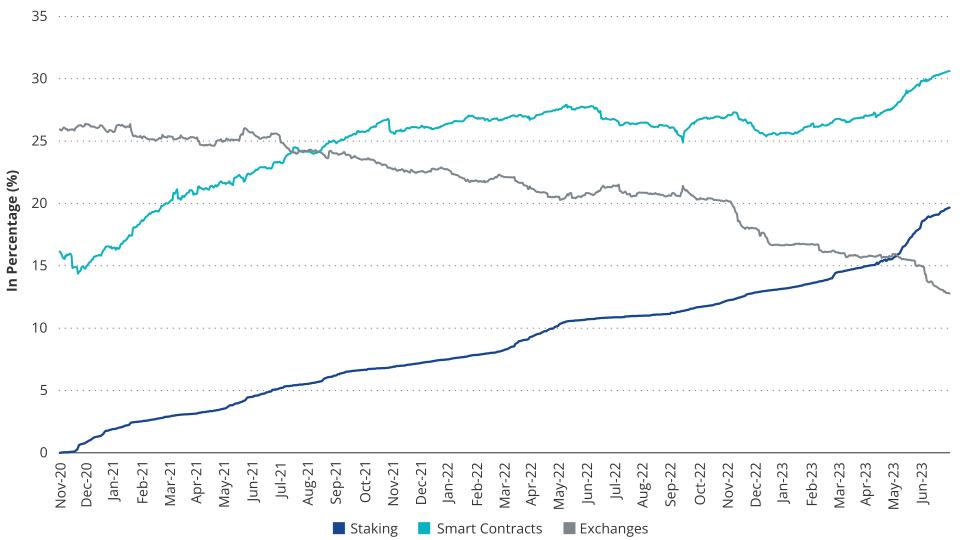
As the base asset by which all other tokens are compared, ETH tends to outperform in bear markets. The month of June was no exception to this general rule as ETH rose 3% while the broader index of SCPs lost just over -6%. The biggest story of the month for Ethereum was the SEC’s conspicuous omission of ETH from its list of securities in both the Binance and Coinbase lawsuits. Additionally, ETH supply dynamics have vastly improved, with supply of ETH on exchanges falling to an all-time low of 13% of total supply. Likewise, ETH staking has climbed to nearly 20% while ETH locked in smart contracts has surpassed 30%. While the ETH staking growth can be attributed to greater comfort spurred by the Shapella upgrade that allows staking withdrawals, smart contract locking can be attributed to the proliferation of yield-generating protocols using ETH and stETH (liquid token given to ETH stakers by liquid staking providers). On the horizon, many more use cases for ETH are emerging, like Eigenlayer, which will allow ETH holders to stake both on-chain and off-chain protocols with ETH. This may include things like oracles, blockchains, computation networks, bridges, and more. These new use cases will likely draw yield-seekers to lock more ETH into smart contracts, which will further diminish liquid supply. As a reminder, we tackled all of these revenue drivers in our for ETH.
ETH Supply Dynamics
Source: Etherscan.io as of 6/30/2023. Past performance is no guarantee of future results. Not intended as a recommendation to buy or sell any securities named herein.
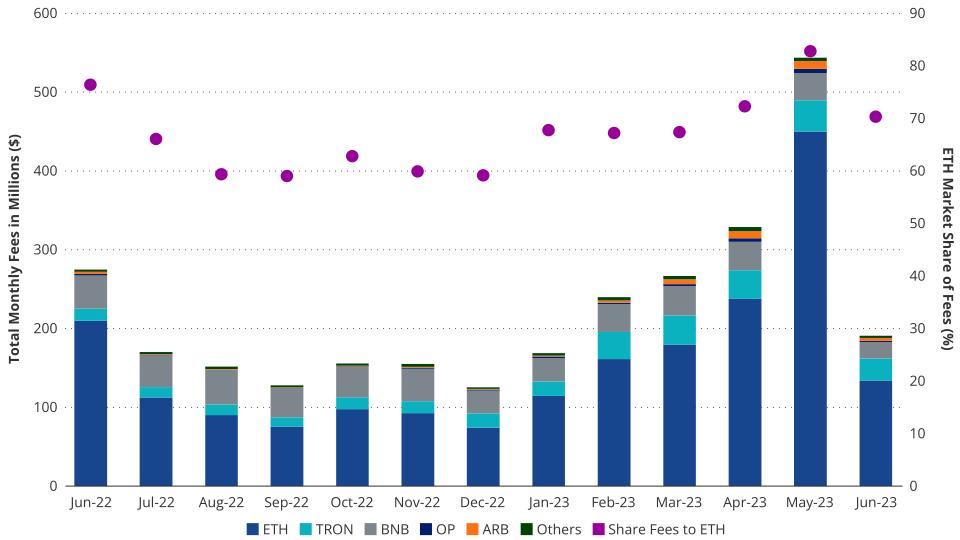
Total Monthly Fees SCPs vs ETH Market Share of Fees
Source: Artemis.xyzas of 6/30/2023. Past performance is no guarantee of future results. Not intended as a recommendation to buy or sell any securities named herein.
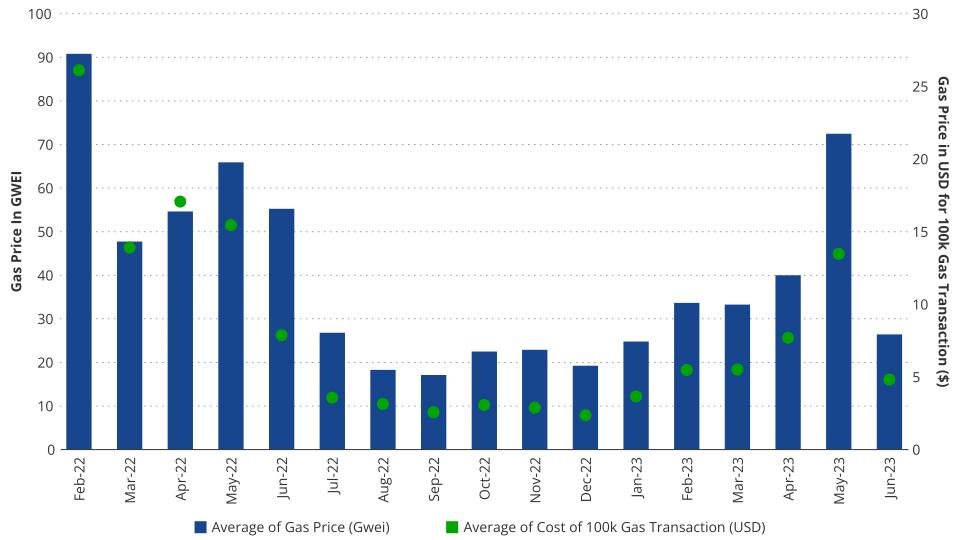
While blockchain activity on Ethereum remained robust, average ETH gas prices (gwei) sunk to their lowest level since January, 26.33 gwei, which was 64% less than May’s average, which was unusually high due to some memecoins (PEPE “the most memeable memecoins” according to its website, peaked at $1.6B market cap in May before falling to $333M in June). Still, Ethereum increased its monthly average daily active user count by 10.5%, from 328k to 363k, while maintaining its share of the layer 1 fee market above 70%.
Ethereum Gas Price (gwei) vs Transaction Costs in USD
Source: Etherscan.ioas of 6/30/2023. Past performance is no guarantee of future results. Not intended as a recommendation to buy or sell any securities named herein.
Polkadot
Breaking a long streak of monthly underperformance, Polkadot (-4%) was able to weather the June Witch a bit better than its peers. As a refresher, Polkadot is a specific type of smart contract platform, called a Layer-0, that does not directly host any smart contracts on its platform. Instead, it is called a sharded blockchain, where the functionalities of smart contracts are outsourced to other blockchains that connect to Polkadot. In return for connecting to Polkadot, these blockchains tap into the security of Polkadot and gain the ability to securely trade messages and assets with other connecting chains. This vision, which pre-dates Ethereum, essentially has solved all the current pain points experienced by Ethereum – high fees, low throughput, messaging between blockchains, and state management. Despite its promise, Polkadot has lost momentum since 2021 as network issues emerged, Polkadot’s Web3 Foundation failed to implement pro-growth policies, and a bridge hack destroyed its nascent community. As a result, Polkadot, though a top 7 asset by market capitalization, is down -90% from all-time highs, while its most successful parachains tokens are down as much as -98.5%. However, despite poor price action, Polkadot still has enormous potential as it retains the second largest full-time developer community, at 775, outside of Ethereum, representing 21% of all blockchain developers.
Polkadot’s outperformance in June can be partly attributed to its exclusion from the SEC’s securities lists. In mid-January, the foundation behind Polkadot, the Web3 Foundation, declared publicly that DOT was a security. Then, at Polkadot’s annual conference in June called “,” Founder Gavin Wood laid out a blockspace-centric vision for Polkadot, including: increasing transaction output capabilities by 10x, creating pay-as-you-go parachains, constructing an active blockspace market, and creating novel low-latency parachains. Another important development was Polkadot's massive change to its governing bodies called “,” which democratizes and decentralizes control of Polkadot’s business, software, and economic update processes. Also contributing to the relative positive sentiment for Polkadot was the recent raise of $37M by , who is building a Polkadot blockchain for gaming and NFTs.
Polygon
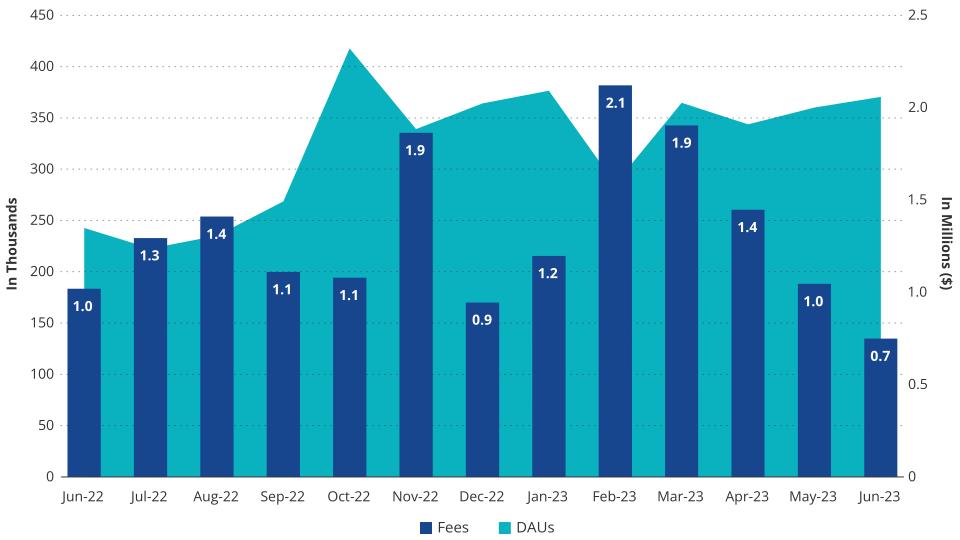
Polygon (MATIC), which lost -26% in the month of June, was the worst performer amongst smart contract blockchains. The price action of Polygon was not encouraging before the month of June, as it was already one of the weakest performers YTD. Despite a slew of positive partnerships with prominent partnerships over the last year with entities like , , Draftkings, , and , Polygon has not seen the follow-through to its bottom line. While Polygon’s userbase, in terms of daily active users, has increased 40% since June 2022, its 3-month moving average for fees has decreased by 13%. This implies that the value of its users has simultaneously reduced, and the costs of running the chain, as Polygon must post data to Ethereum, have increased.
Polygon Daily Active Users vs. Monthly Fees
Source: Artemis.xyz as of 6/30/2023. Past performance is no guarantee of future results. Not intended as a recommendation to buy or sell any securities named herein.
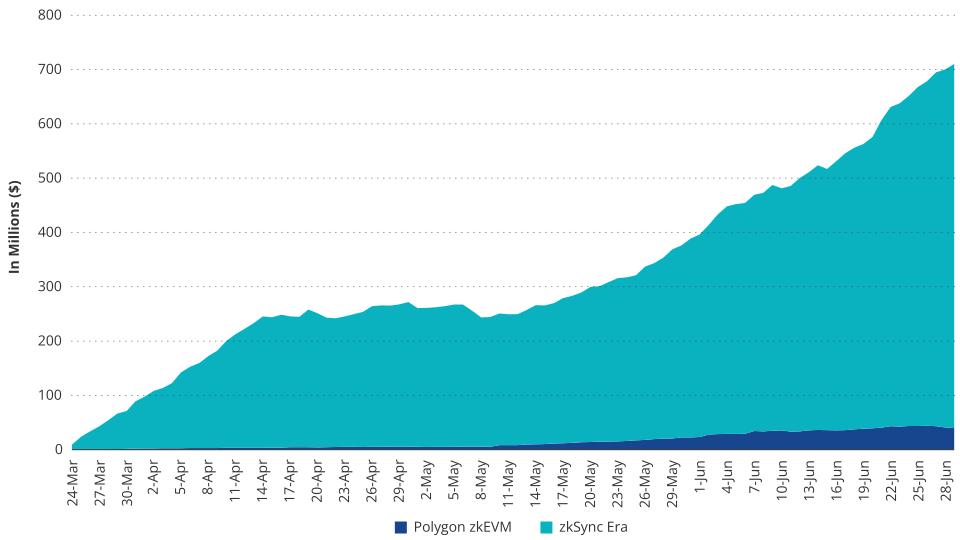
Polygon’s issues increased in June when the SEC cited it as a security in the cases against Binance and Coinbase. Exacerbating matters, Polygon Labs, the entity that designed Polygon, did not directly deny the SEC’s by curiously contending that they “did not target the US at any time.” As a result of the SEC action, both and ICE’s Bakkt exchange announced they would delist MATIC. Furthermore, Robinhood announced that any MATIC left on its platform after June 27 would be market-sold and the customers refunded in USD. eToro also followed suit in MATIC. Amid the flurry of bad news and price declines, a large MATIC holder unstaked and liquidated 115.27M MATIC ($95.71). Finally, Polygon’s future for scaling, its Layer-2 zero-knowledge project called zkEVM, is showing extremely tepid adoption compared to its main competitor zkSync Era. Polygon’s zkEVM has only 1/17th of the TVL of zkSync’s Era.
TVL: Polygon zkEVM vs zkSync Era
Source: Dune @tomanhh, @0vix_wizards as of 6/30/2023. Past performance is no guarantee of future results. Not intended as a recommendation to buy or sell any securities named herein.
To stem the longer-term token price decline and refresh the Polygon network, Polygon has launched what it calls . In their official blog posting, on June 12, they announced a series of upgrades that create “the value layer of the internet.” Implementation would consist of addressing tokenomics issues with MATIC while increasing network throughput and efficiency. The first step was announced on June 19, which was the revamp of Polygon’s main network, called Polygon PoS, to improve transaction throughput and prevent that have plagued Polygon. Going forward, Polygon is set to announce changes to its token structure and new developments for its planned network of blockchains it calls Polygon “Supernets.”
BNB
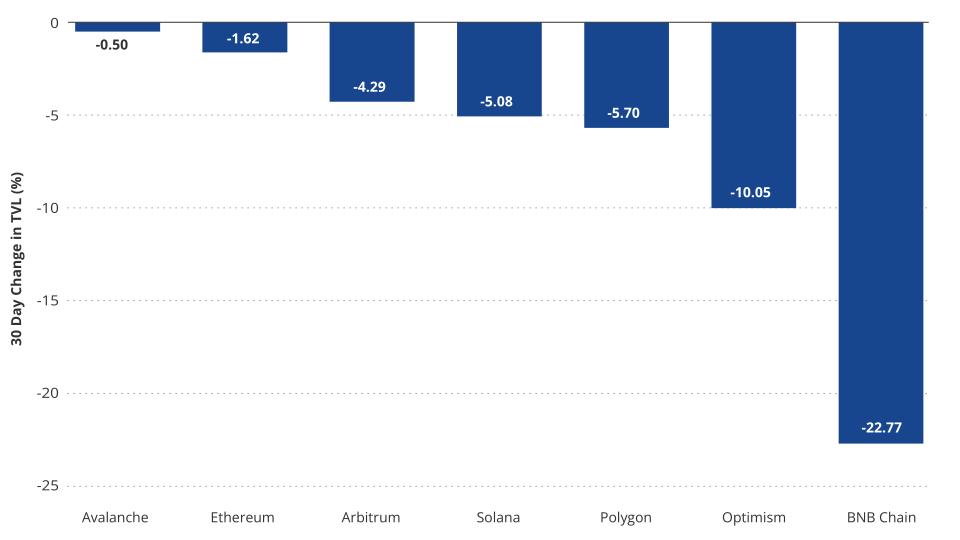
BNB had its worst month to date this year, marked by a 23% drop in token price. This decrease was primarily driven by a combination of funds exiting the ecosystem and reduced fees generated. Over the past 30 days, the Total Value Locked (TVL) on the BNB chain declined by nearly $1B, settling at just $3.4B. This latest June TVL figure contrasts starkly with last year's figure of $5.3B and represents a 36% YoY drop. Compared to other ecosystems, in percentage terms, the decline in BNB chain’s TVL was twice as much as Optimism's and 14x as much as Ethereum's. The key trigger for the abrupt decrease in TVL was multiple government enforcement actions against the associated Binance exchange.
TVL Drawdown: June 2023
Source: Artemis.xyz as of 6/30/2023. Past performance is no guarantee of future results. Not intended as a recommendation to buy or sell any securities named herein.
Earlier in the month, the SEC filed a against the Binance exchange and its founder, Changpeng Zhao, for listing unregulated securities, including BNB. After the lawsuit, it also received a to freeze Binance's US customer assets. In Europe, Binance failed to acquire an operating license from and was ordered to stop all operations in . Moreover, the number of daily active addresses has remained relatively stable over the past two months. This suggests that the decrease in TVL is not due to a collection of smaller retail users but rather larger holders managing their risk due to the close connection with Binance. Alongside the outflow of user funds, transaction-related fees and revenue have dropped by 25% over the past 30 days. Currently, 10% of BNB gas fees are burned and removed from the circulating supply, so this reduction in fees generated is a significant factor driving the recent depreciation of the token.
As the price of BNB has declined, it has approached the point of a levered trader with $236M worth of BNB on Venus protocol, the top lending platform on the BNB chain. If the price of BNB drops to $218, the position will fall below its collateral requirement and can be liquidated. This would lead to a market-sell order and almost certainly trigger a large drop in the token price. Luckily for BNB holders, the situation has been alleviated with a governance proposal passing that enables the BNB ecosystem team to execute the liquidation spread over a period of time rather than one immediate transaction.
Cardano
Cardano, whose ADA token fell 25% in June, suffered gravely from June Witch’s wrath. The SEC lawsuit against Binance hit Cardano especially hard due to follow-on effects, including Robinhood selling off all ADA, MATIC, and SOL by June 27th. Simultaneously, Celsius also various customer altcoins, including Cardano, by converting them into Bitcoin and Ethereum. The combined $56 million ADA held by Celsius and represent 25% of the daily average volume for ADA (though it can be sold over a years-long winddown). Likewise, the citation by the SEC enhances the possibility of direct action by the agency against Cardano. Adding further to the downward pressure was the and layoff of staff from Cardano developer entity IOG.
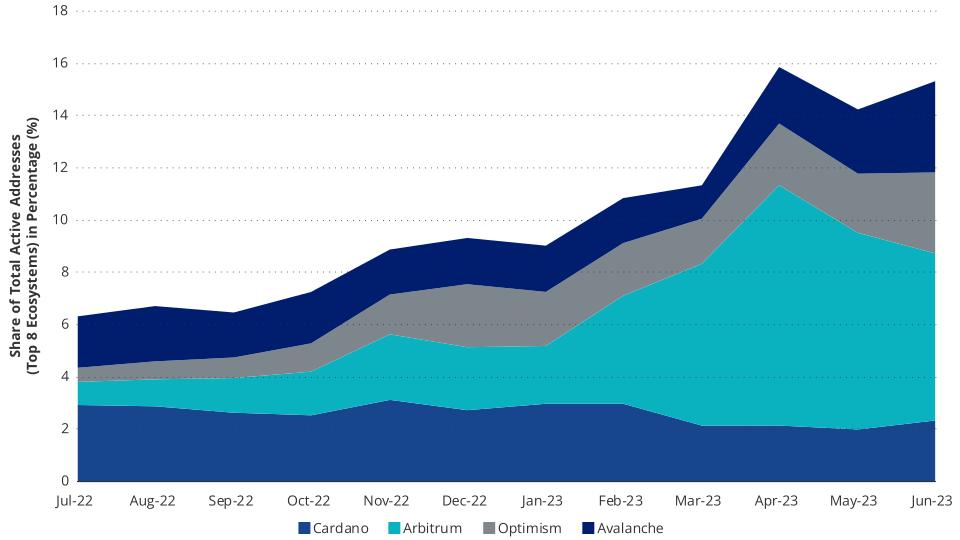
Coming into the month, Cardano, though buoyed by the charismatic leader Charles Hoskinson who has cultivated a diehard Cardano community, had been beset by the slow pace of functionality improvements on its platform, resulting in a lack of user share growth vs. competing blockchains. For example, Cardano has fallen below 2% of all SCP users. And while Cardano’s TVL has grown enormously since the start of the year, from $49M to $153M, it has lagged mightily behind ETH layer 2s like OP & ARB, whose combined TVL has surged by more than $1.4B. Similarly, the lack of development pace has also stunted the growth of Cardano’s DEX ecosystem, as Cardano hosts about 50% of the volumes of Optimism and about 8.5% of the activity of Arbitrum.
Cardano Fails to Grow Share of Total Users
Source: Artemis.xyz as of 6/30/2023. Past performance is no guarantee of future results. Not intended as a recommendation to buy or sell any securities named herein.
Though prices declined, Cardano has positive developments as its DEX activity, though small and lagging, continue to grow amid contract upgrades. DEX volume on Cardano increased DEX volume by 20% in June compared to May, which was the highest increase amongst comparable blockchains, as most others were negative. This activity increase resulted from Cardano’s 8.1.1 Upgrade, which offered significant performance improvements, enabling more DEX transaction throughput.
DeFi June 2023 Updates: Ethereum Claims Larger Share in Volume
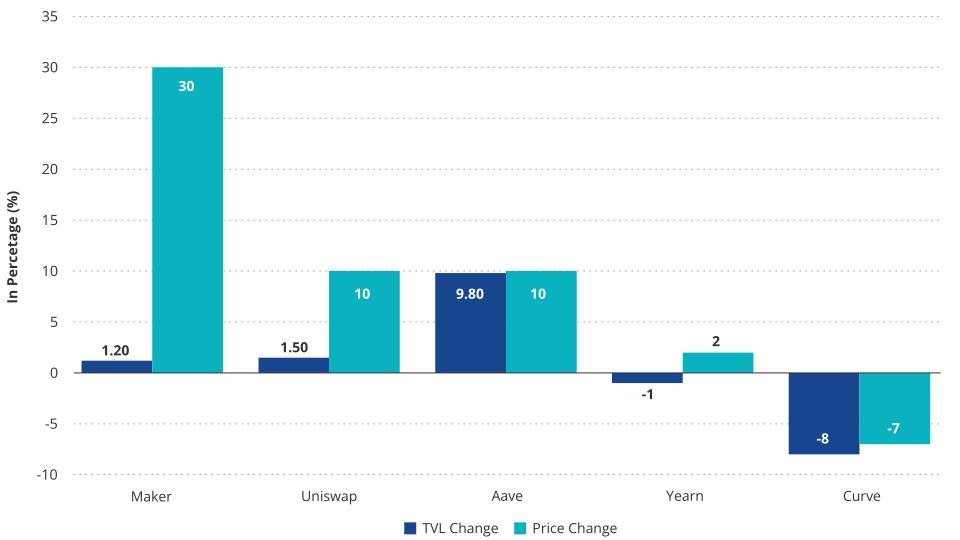
The Market Vector Decentralized Finance Leaders Index fell 1% in June. The total value locked in DeFi protocols dropped 4%, with Curve and Convex recording slightly larger drops than other protocols with more than $1B TVL. MKR led DeFi tokens with a 30% end-of-month rally while UNI and AAVE each rose about 10%, YFI gained 2%, and CRV fell nearly 7% as shorts piled in mid-month to try and liquidate the founder’s CRV position on Aave.
June DeFi Protocol TVL & Price Movement
Source: Artemis.xyz as of 6/30/2023. Past performance is no guarantee of future results. Not intended as a recommendation to buy or sell any securities named herein.
Decentralized exchange volume fell slightly, but Ethereum’s share rose about 6% in June, according to DeFiLlama. Arbitrum and BNB are the only chains other than Ethereum enabling over 10% of decentralized exchange volume (14.5% & 16.5% in June). Next is Polygon with 5.5%. Solana, Arbitrum, and Polygon are the best chains to provide liquidity, supporting more volume relative to liquidity than other chains. But when controlling for liquidity, Arbitrum appears to be still the preferred chain to trade on, supporting about 1/3 of the weekly volume of Ethereum with only 1/6 the liquidity.
| June Decentralized Exchange Efficiency by Chain | |||
| Dex Volume (B) | Dex TVL (B) | Liquidity Efficiency | |
| Ethereum | 35.8 | 8.6 | 4.2 |
| Arbitrum | 11.5 | 1.3 | 8.8 |
| BNB | 10.1 | 1.9 | 5.4 |
| Polygon | 3.9 | 0.5 | 8.6 |
| Avalanche | 1.3 | 0.3 | 4.7 |
| Optimism | 1.2 | 0.4 | 3.4 |
| Solana | 1.06 | 0.1 | 10.6 |
Source: DefiLlama, VanEck research, as of June 30th. Past performance is no guarantee of future results. Not intended as a recommendation to buy or sell any securities named herein. Dex Volume refers to the total decentralized exchange volume for the respective blockchain. Dex TVL refers to the Total Value Locked in decentralized exchanges. Liquidity Efficiency refers to Dex volume/Dex TVL.
Some notable Defi events in June included:
- Uniswap Foundation released details regarding the functionality and vision of Uniswap V4. Specifically, the plans laid out a vision for programmable liquidity strategies via “hooks” and their new singleton contract, consolidating much of the repetitive code in deploying liquidity to standardize the ecosystem development that will undoubtedly occur on top of the Uniswap framework. This could lead to increased business lines for protocols that thrive on providing users with advanced yield strategies, such as Yearn and Beefy Finance. That being said, we expect that a plethora of new applications for this framework will be discovered as the top minds in smart contract development audit the code and brainstorm the products they can build from hooks.
- Halfway through the month, Tether’s USDT depegged by almost 50 bps as investors feared continued SEC enforcements could eventually lead to Tether or its largest users being criminally indicted. This fear led to the Curve 3pool USDT concentration rising above 70% as investors sold their USDT. However, it soon returned to normal as investors regained conviction and arbitraged the pool back to normal. The USDT concentration in the 3pool is 34% at the time of writing.
Important Governance Activity:
Aave:
- ARFC: GHO Mainnet Launch - receiving final feedback before an AIP can be voted on by the DAO
- Temperature check on Integrating MakerDAO’s DSR into Aave V3 Ethereum pool - results!
Uniswap:
- Temperature check to deploy V3 on Fantom and Filecoin’s FVM - both passed.
Yearn:
- Activate veYFI rewards with oYFI gauges - in discussion.
Synthetix:
- Add stETH/USD to synthetic perps - passed.
Stablecoins
crvUSD supply grew 340% throughout the month, from $10M to $44M at the time of writing. Additionally, fees generated from crvUSD have surpassed $125k in just a month and a half since launch. The growth can mainly be attributed to the addition of wstETH, wBTC, and wETH debt markets and the incentivized crvUSD liquidity pools that essentially allow users to be paid to take out loans. For example, many users have deposited interest-bearing collateral such as sfrxETH or wstETH, which yield 4-5% APR intrinsically, borrow crvUSD at 7-8% and deposit it in Conic Finance’s crvUSD omnipool to earn 13% from the compounded CRV emissions. Beyond incentivization, crvUSD also provides value to users through the soft liquidation method that reduces volatile asset exposure as price declines, and collateral is called and increases exposure as price moves retraces up.
With the final comments rolling in on Aave’s proposed GHO launch, we expect an AIP to be proposed and passed in July, approving GHO’s mainnet launch. Meanwhile, MakerDAO increased the DAI savings rate to 3.49% to provide DAI holders a higher risk-fee yield and the ability to hold yield-bearing DAI via the new ERC-4626 vault token, sDAI. The change prompted a reversal in DAI’s market capitalization from its mid-month low of $4.59 billion to $4.69 billion at the time of writing. Borrows on Spark increased 50% to $15m, lagging behind the growth of crvUSD partially due to less incentivization and having only a $20m debt limit.
Reserve protocol (RSP) initiated a $20 million acquisition of Curve assets, a process that will span the summer and serve as an incentive for liquidity in their tokens. The protocol facilitates the decentralized creation of asset-backed stablecoins known as "RTokens." By investing in Curve assets, the Reserve team demonstrates their confidence in the long-term significance of the Curve ecosystem within the decentralized finance (DeFi) landscape. The acquired SDT, CVX, and CRV will be locked and utilized to direct emissions toward their respective RTokens' pools. Noteworthy early investors in Reserve include Sam Altman and Peter Thiel.
As the end of the month neared, stablecoin TUSD lost its peg on Binance.US, falling briefly to $0.80, and grew to over 70% concentration in its Curve liquidity pool as investors feared TUSD’s exposure to Prime Trust could make it insolvent. The reserve reports later stated a mere $26k of TUSD assets were impacted. Unlike USDT, however, the TUSD Curve pools still remain imbalanced, with the TUSD 3pool at 65% TUSD concentration at the time of writing, indicating investor fear still hasn't fully subsided.
Metaverse, Gaming, & Web3
Investors had hoped for an upward trend in metaverse tokens during June due to the unveiling of Apple's latest headset, Apple Vision Pro. However, their expectations were left unfulfilled as numerous prominent metaverse tokens were classified as securities due to the SEC lawsuits targeting Coinbase and Binance within the same week. Consequently, the Market Vector Media and Entertainment Leaders Index (MVMELE) fell 22% in June, primarily driven by 4 out of 5 index components, accounting for 76% of the index's weight, being designated as unregistered securities in the SEC's latest enforcement actions (MANA, CHZ, SAND, & AXS).
APE was the sole token in MVMELE not designated an unregistered security in SEC lawsuits. However, in June, the Yuga Labs ecosystem encountered challenges when MachiBigBrother conducted a market dump of over $1 million worth of BAYC NFTs via Blur. Moreover, Machi initiated a defamation lawsuit against well-known on-chain investigator @zachxbt for an article published in June 2022, which garnered negative reactions within the crypto community. This incident underscores the concentrated ownership of even the largest NFT collections and their influence on market movements. Additionally, the APE token staking rewards, which commenced in December and were previously highlighted in an article, likely intensified selling pressure. APE fell 28% in June.
Unique active wallets interacting with the top Web3 games remained fairly stagnant in June, decreasing about 3%. Still, despite the overall lackluster activity, venture investors continue to fund projects at relatively high valuations, with Mythical Games successfully securing $37 million in funding through a Series C1 extension round. The funding was led by Scytale Digital, with participation from ARK Invest, Animoca Brands, MoonPay, and existing investors. This recent investment follows the company's previous $150 million Series C round in November 2021, led by Andreessen Horowitz, which valued Mythical Games as a "unicorn" at $1.25 billion. Since its launch, Mythos Chain has been steadily climbing the CryptoSlam NFT volume rankings and currently holds the 4th position in monthly NFT sales, with a total volume of $30 million. Due to the established user acquisition channels and strong investor conviction demonstrated in the recent investment round, the Mythos web3 gaming ecosystem could be web3’s breakout gaming chain.
Meanwhile, as the crypto community continues to try to build decentralized social media alternatives to web 2.0 giants, one leading contender encountered a familiar obstacle in June: Damus, an emerging decentralized social media application built on Jack Dorsey's NOSTR protocol, faced the possibility of being removed from the Apple app store unless its BTC tipping functionality was eliminated. The inclusion of this tipping feature had raised concerns during Apple's App Store review process. Apple perceives these tips as in-app purchases for digital content, thereby requiring them to be processed exclusively through Apple's in-app purchase system. This action by Apple reflects their ongoing commitment to regulating user access unless they can obtain a share of economic activity through their in-app purchase system. This potential “delisting” from the app store illustrates the challenges web3 apps face in gaining adoption while further reinforcing the justification for social media apps to be built on decentralized networks in the first place.
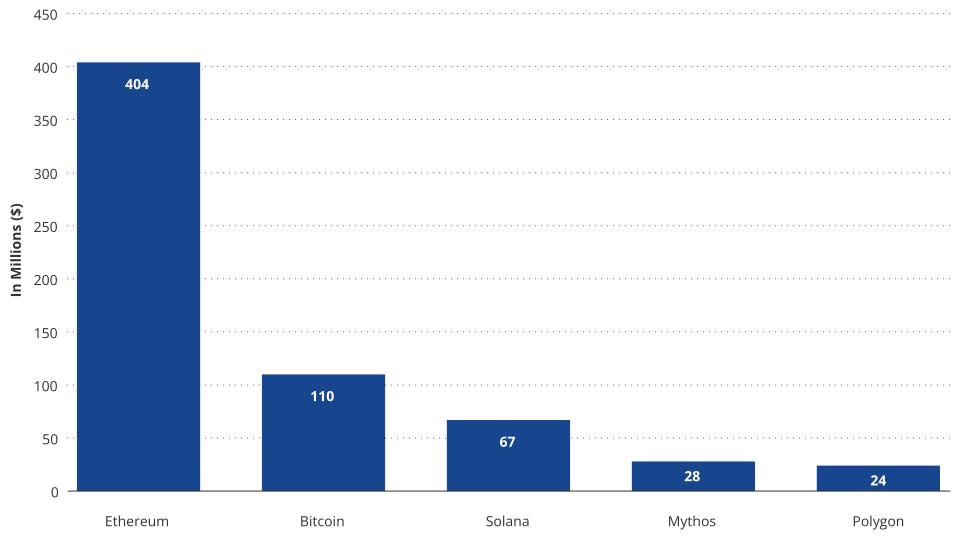
NFTs June 2023 Updates: Overall Decline in Volume
In June, the aggregate volume of NFTs experienced a decline of approximately 4.5% to $706 million, as reported by CryptoSlam! Bitcoin Ordinals activity continuously declined throughout June, with volume dropping nearly 50% to $100 million. Despite reduced buying activity overall, Bitcoin remains the second-highest chain in terms of NFT volume over the past 30 days.
Within the Ethereum NFT market, Blur's market share in volume grew from 69% to 75%, while Blend maintained its dominant position in the NFT lending sector with over 90% market share. BLUR investors eagerly await August 14th, when they can vote on implementing a fee for the protocol's services, which will determine Blur's ability to sustain its dominance and generate revenue. Notably, Azuki and Bored Ape Yacht Club (BAYC) NFTs have accumulated significantly higher outstanding debts as collateral, with 6.4k ETH and 5.9k ETH outstanding, respectively.
June NFT Volume
Source: CryptoSlam, as of 6/30/23. Past performance is no guarantee of future results. Not intended as a recommendation to buy or sell any securities named herein.
The Azuki Elementals NFT mint tripled the original Azuki supply, adding 20,000 NFTs to the existing 10,000. The collection drew criticism due to its disproportionately large supply and the lack of uniqueness in the revealed NFTs, leading many on crypto Twitter to view it as a dilutive mechanism. Consequently, the Azuki floor price plummeted by 50% following the reveal and has since stabilized around 8.5E, with Azuki Elementals trading well below their mint price of 2E at around 1.5E.
Links to third party websites are provided as a convenience and the inclusion of such links does not imply any endorsement, approval, investigation, verification or monitoring by us of any content or information contained within or accessible from the linked sites. By clicking on the link to a non-VanEck webpage, you acknowledge that you are entering a third-party website subject to its own terms and conditions. VanEck disclaims responsibility for content, legality of access or suitability of the third-party websites.
Important Information
We publish this newsletter to inform and educate about recent market developments and technological updates, not to give any recommendation for certain products or projects. The selection of articles should therefore not be understood as financial advice or recommendation for any specific product and/or digital asset. We may occasionally include analysis of past market, network performance expectations and/or on-chain performance. Historical performance is not indicative for future returns.
ETN Disclaimer
Important information
For informational and advertising purposes only.
This information originates from VanEck (Europe) GmbH, Kreuznacher Straße 30, 60486 Frankfurt am Main. It is intended only to provide general and preliminary information to investors and shall not be construed as investment, legal or tax advice. VanEck (Europe) GmbH and its associated and affiliated companies (together “VanEck”) assume no liability with regards to any investment, divestment or retention decision taken by the investor on the basis of this information. Views and opinions expressed are current as of the date of this information and are subject to change with market conditions. Certain statements contained herein may constitute projections, forecasts and other forward looking statements, which do not reflect actual results. VanEck makes no representation or warranty, express or implied regarding the advisability of investing in securities or digital assets generally or in the product mentioned in this information (the “Product”) or the ability of the underlying Index to track the performance of the relevant digital assets market.
The underlying Index is the exclusive property of MarketVector Indexes GmbH, which has contracted with CryptoCompare Data Limited to maintain and calculate the Index. CryptoCompare Data Limited uses its best efforts to ensure that the Index is calculated correctly. Irrespective of its obligations towards the MarketVector Indexes GmbH, CryptoCompare Data Limited has no obligation to point out errors in the Index to third parties.
Investing is subject to risk, including the possible loss of principal up to the entire invested amount and the extreme volatility that ETNs experience. You must read the prospectus and KID before investing, in order to fully understand the potential risks and rewards associated with the decision to invest in the Product. The approved Prospectus is available at www.vaneck.com . Please note that the approval of the prospectus should not be understood as an endorsement of the Products offered or admitted to trading on a regulated market.
Performance quoted represents past performance, which is no guarantee of future results and which may be lower or higher than current performance.
Current performance may be lower or higher than average annual returns shown. Performance shows 12 month performance to the most recent Quarter end for each of the last 5yrs where available. E.g. '1st year' shows the most recent of these 12-month periods and '2nd year' shows the previous 12 month period and so on. Performance data is displayed in Base Currency terms, with net income reinvested, net of fees. Brokerage or transaction fees will apply. Investment return and the principal value of an investment will fluctuate. Notes may be worth more or less than their original cost when redeemed.
Index returns are not ETN returns and do not reflect any management fees or brokerage expenses. An index’s performance is not illustrative of the ETN’s performance. Investors cannot invest directly in the Index. Indices are not securities in which investments can be made.
No part of this material may be reproduced in any form, or referred to in any other publication, without express written permission of VanEck.
© VanEck (Europe) GmbH
Important Disclosure
This is a marketing communication. Please refer to the prospectus of the UCITS and to the KID before making any final investment decisions.
This information originates from VanEck (Europe) GmbH, which has been appointed as distributor of VanEck products in Europe by the Management Company VanEck Asset Management B.V., incorporated under Dutch law and registered with the Dutch Authority for the Financial Markets (AFM). VanEck (Europe) GmbH with registered address at Kreuznacher Str. 30, 60486 Frankfurt, Germany, is a financial services provider regulated by the Federal Financial Supervisory Authority in Germany (BaFin).
The information is intended only to provide general and preliminary information to investors and shall not be construed as investment, legal or tax advice VanEck (Europe) GmbH, VanEck Switzerland AG, VanEck Securities UK Limited and their associated and affiliated companies (together “VanEck”) assume no liability with regards to any investment, divestment or retention decision taken by the investor on the basis of this information. The views and opinions expressed are those of the author(s) but not necessarily those of VanEck. Opinions are current as of the publication date and are subject to change with market conditions. Certain statements contained herein may constitute projections, forecasts and other forward-looking statements, which do not reflect actual results. Information provided by third party sources is believed to be reliable and have not been independently verified for accuracy or completeness and cannot be guaranteed. Brokerage or transaction fees may apply.
All performance information is based on historical data and does not predict future returns. Investing is subject to risk, including the possible loss of principal.
No part of this material may be reproduced in any form, or referred to in any other publication, without express written permission of VanEck.
© VanEck (Europe) GmbH / VanEck Asset Management B.V.